Reports
This menu allows you to create dashboards and add and / or view reports.
Dashboards
New Dashboard
The Dashboard is a container for multiple reports. Keep all the reports to view together on one dashboard. At least one dashboard is required to start creating reports.
To create a new Dashboard:
- Click New Dashboard. The New Dashboard dialog appears.
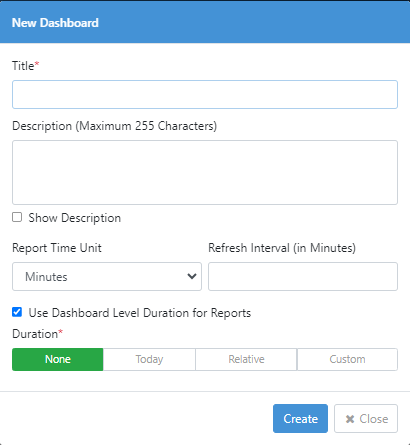
Figure 14.1: New Dashboard
- Enter the following field details:
| Field name | Description |
|---|---|
| Title | Provide a name for the dashboard. |
| Description | Enter a description for the dashboard. |
| Show Description | Select the checkbox if you want to show the description of the dashboard on the dashboard page. |
| Report Time Unit | Select the report time unit in seconds or minutes or hours. |
| Refresh Interval(in Minutes) | Enter the interval in minutes to refresh th dashboard view. You can set the refresh interval between 1-15 minutes. |
| The user session will time out only after the specified time interval. | |
| Use Dashboard Level Duration for Reports | Select the checkbox if you want to have a global duration for all reports on the dashboard, which will show data for the specified period. |
| If you select the checkbox, then you cannot specify duration for individual reports. | |
| Duration | Click any of the following tabs, as required for the dashboard: |
| - None: No duration details are required. | |
| - Today: Enter the start and end hour in hours and minutes. | |
| - Relative: Enter the duration in minutes or hours or days or months or years, either in the Last or Next tab. | |
| - If you select the Last tab then the generated report shows details of previous minutes or hours or days or months or years. | |
| - And, if you select Next then the generated report shows details of upcoming minutes or hours or days or months or years. | |
| - Custom: Select the date range for which you want to generate the report. |
- Click Create. Dashboard created successfully message appears.
You can select other dashboard from the list adjacent to the dashboard name.

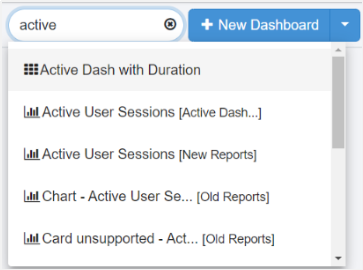
You can find dashboards and reports using the search option. Enter at least two characters of the name of the dashboard or report in the search box and click![]()
![]() : indicates a dashboard
: indicates a dashboard
![]() : indicates a report. In the list, the report name is followed by the name of the dashboard on which the report is available. For example, Active User Sessions [Active Dashboard].
: indicates a report. In the list, the report name is followed by the name of the dashboard on which the report is available. For example, Active User Sessions [Active Dashboard].
If you searched for the dashboard then the dashboard appears with the reports, and if you searched for a particular report then the report appears on the dashboard and is highlighted in yellow briefly.
 You can search for both types of reports, that is, Out-of-the-box and Custom reports.
Dashboard Options
Click the dropdown icon next to New Dashboard to perform the following actions:
-
Edit Dashboard: Click to modify the selected dashboard settings.
-
Set As Default: Click to set the selected dashboard as the default dashboard.
After you set the dashboard as the default dashboard, the Set As Default option is unavailable.
- Pin to Home Page: Click to pin the dashboard to the Home page.
-
The dashboard replaces the top four chart view on the Home page under the License Overview, Agent Threads, Assisted Agents, Step Units, and Process Studios section.
-
After you pin the dashboard to the Home page, the Unpin from Home Page option is available.
- Allow Public Access: Click to allow other tenant users of the specific tenant to view the dashboard.
The dashboard name is suffixed with the term Public in the dashboard name list.
![]()
- After you make the dashboard public, the Remove Public Access option is available.
-
Toggle Fullscreen Mode: Click to view the dashboard page in full screen mode.
-
Add Report: Click to add the report on the dashboard.
-
Delete Dashboard: Click to delete the dashboard.
Maintain Reports on Dashboard
Add Report
Reports can be created and viewed in a tabular or card or chart view. Choose dates or relative periods like hours, minutes, days, weeks or months, to generate reports. You can also edit dashboards to get the options to edit reports.
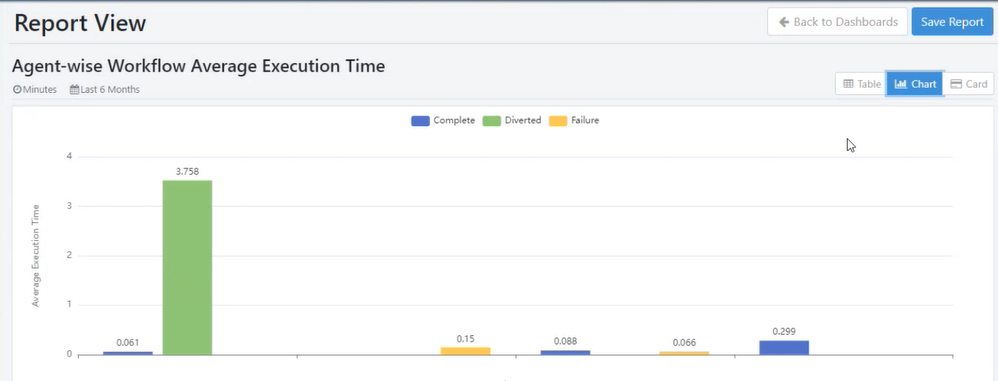
Note: Chart view is available in certain reports only. For example, Agent-wise Workflow Average Execution Time.
The reports can help you monitor your automation performance in several aspects.
Following are the steps to create a New Report,
-
In the menu pane, click Reports. The default dashboard view appears.
-
Select a dashboard from the dashboard name list. For example, Productivity.
-
Click the dropdown icon next to New Dashboard, and then click Add Report. The New Report dialog appears.
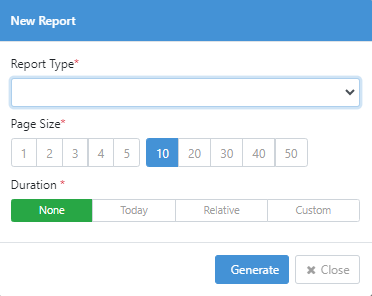
Note: The Duration field is available only if the Use Dashboard Level Duration for Reports checkbox in the New Dashboard dialog is clear.
- Enter the following field details:
| Fields | Description |
|---|---|
| Report Type | Select the type of report you want to generate. |
| See Out of the box reports for a description about the reports. | |
| Generate On | Select the radio button next to Workflow or Categories. |
| Note: Depending on the option selected, the Select Workflows or Select Categories field is available. | |
| Select Workflows / Categories | Select the workflows or categories for which you want to generate the report. |
| Select Agents | Select the agents for which you want to generate the report. |
| Note: Select the agents only if you want to generate reports, such as Top Agents with error or Success Rate-Agent. Else, the selection will be ignored. | |
| Page Size | Click the page size tab, as required. |
| Duration* | Click any of the following tabs to specify the duration: None or Today or Relative or Custom. |
| Note: | |
| - If the Use Dashboard Level Duration for reports is selected, then the report inherits the duration details from the dashboard. | |
| - Duration type description is same as | |
| provided in the New Dashboard section. |
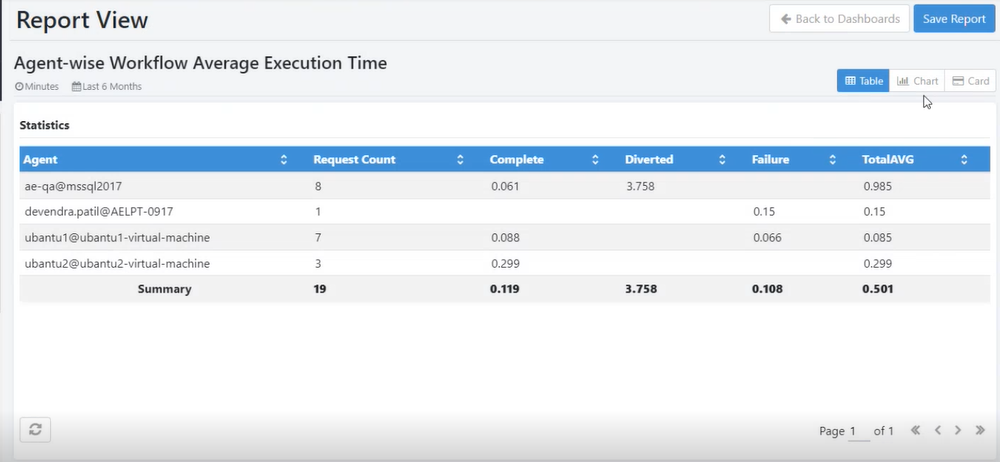
- Click Generate. The Report View page appears.
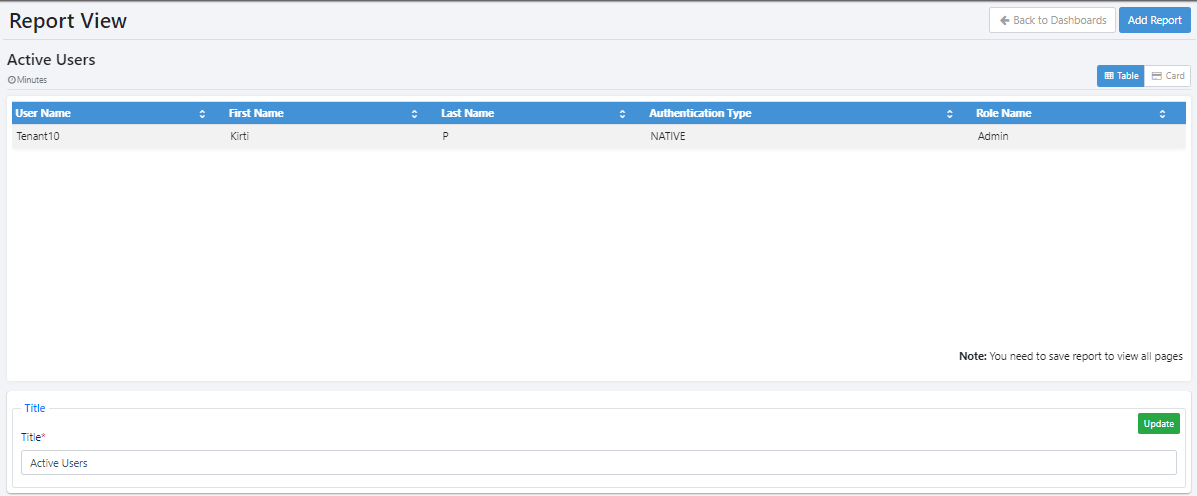
Figure 14.2: Report View
The following tabs are available in the Reports View:
Table: Tabular format is the default view. You can sort the report in an ascending or descending order. In the Title field, modify the report name, and then click Update.
Card: The report appears as a card displaying details of the first record.
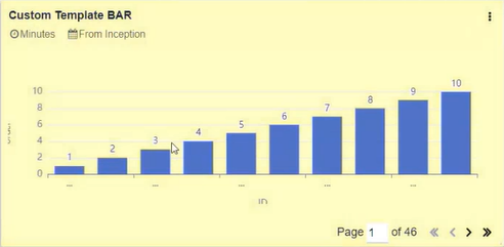
Chart: The report appears as chart, such as Bar chart, Pie chart, and so on.
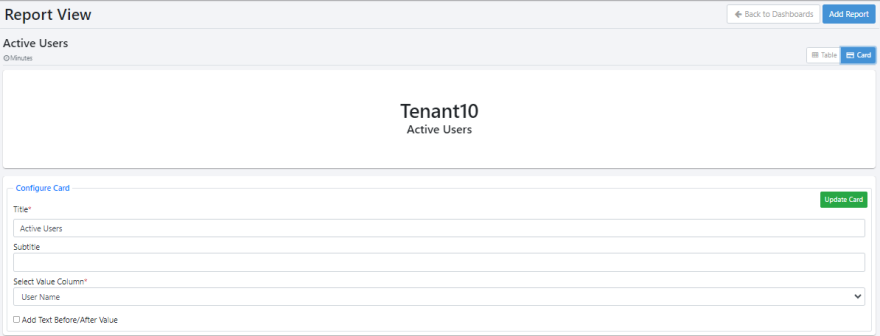 In the Configure Card section, modify the following field details, and then click Update Card:
- Title: Modify the name of the report.
- Subtitle: Enter a sub title for the report, if required.
- Select Value Column: Select the column whose value you want to show in the card.
- Add Text Before/After Value: Select the checkbox to add text before or after the displayed value.
- Click Add Report. The report is added to the dashboard.
OR
Click Back to Dashboard to discard the report.
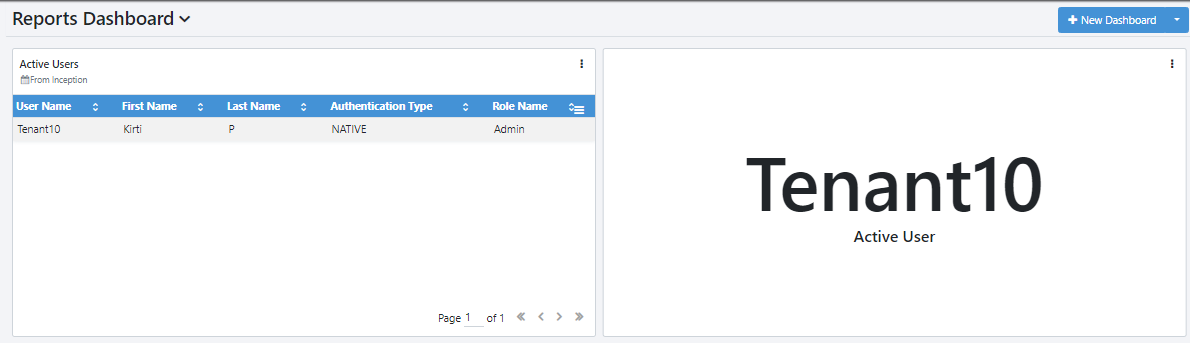
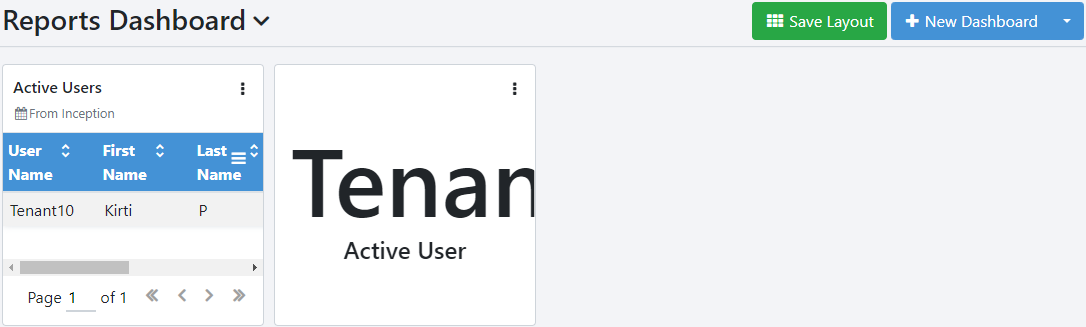
- Click Save Layout, to save the look and feel of the dashboard.
You can save the layout each time you resize or reposition the reports on the dashboard.
Report Options
There is a set of report options that you can access in the report. Click the vertical ellipse available in the top-right corner of the report page. The report options appear.

Figure 14.3: Report Options
Following are the report options:
i. Refresh: Click to refresh the report view. ii. Maximize: Click to maximize the selected report view and scroll through the pagination option, if available.
iii. Download PDF: Click to download the report as a PDF.
iv. Download CSV: Click to download the report in CSV format.
v. Edit Report: Click to update the selected report details, such as duration, page size, and so on, and then generate the report again.
vi. Customize: Click to customize the selected report in a maximized view, as required. You can change the view type, Table, Chart, or Card, as supported by the template.
vii. Remove: Click to delete the report from the dashboard.
In the tabular format of the report, use the toggle to add or remove columns from the selected report view.

Report Options
To generate reports with Chart view:
-
In the Add Report dialog, select the report, which provides the Chart view option.
-
Click Chart tab. The chart view appears.
-
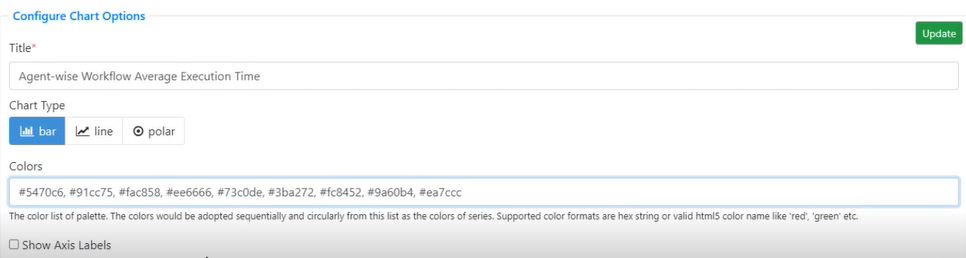
In the Configure Chart Options section, set the following:
| Field | Description |
|---|---|
| Title* | Enter the title of the report. |
| Chart Type | Click respective tab to generate the report |
| view: | |
| - Bar: Data is represented with bars. | |
| - Doughnut: Data is represented in a circular format with different colors. | |
| - Gauge: Displays the partial progress towards a specific value. The value is | |
| derived from the first row result of the report query. | |
| - Line: Graph uses lines to connect individual data points. | |
| - Pie: Data is represented in a pie format with different colors. | |
| - Polar: The following image represents the polar view. | |
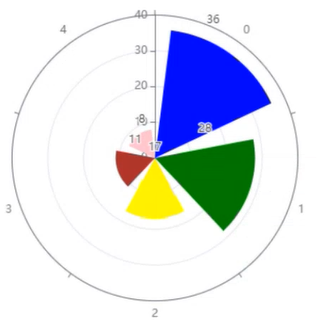 | |
| - Step line: Data is represented in step line chart format.\ | |
| Note: The report view is applicable for Agent Utilization Report. | |
| Colors | Enter the color codes with which you want to represent the data in the chart view. |
| Note: You can enter multiple color codes in the hex string or valid html5 color names. | |
| Show Axis Labels | Select the checkbox if you want labels to appear on the X-axis. |
| The following fields are available only if you select Gauge chart type: | |
| Minimum Value | Enter the minimum value from which the calibration will start. |
| For example, 0 | |
| Maximum Value | Enter the maximum value where the calibration will end. For example, 40. |
| Start Angle | Enter the angle at which the minimum value will be viewed. |
| End Angle | Enter the angle at which the maximum value will be viewed. |
| Use Color Codes | Select the checkbox to use the predefined color codes from the custom report template. |
| Note: Configure the color codes as type String in the Report column of the custom report template. The color codes must be entered in decimal format in the range 0 to 1.0. |
-
Click Update. The settings are applied to the view.
-
Click Save Report. The report appears on the dashboard.
Out of the box Reports
AutomationEdge comes with the following predefined report types; reports based on these can help you monitor your automation performance in several aspects. You can see the reports in tabular or card view.
The localization of currency values for reports such as Total Profitability are based on the language selected in AutomationEdge, View Profile User Profile dialog Language. If the language is not selected in the AutomationEdge UI, then the browser’s localization settings are applied. See the following screenshot:
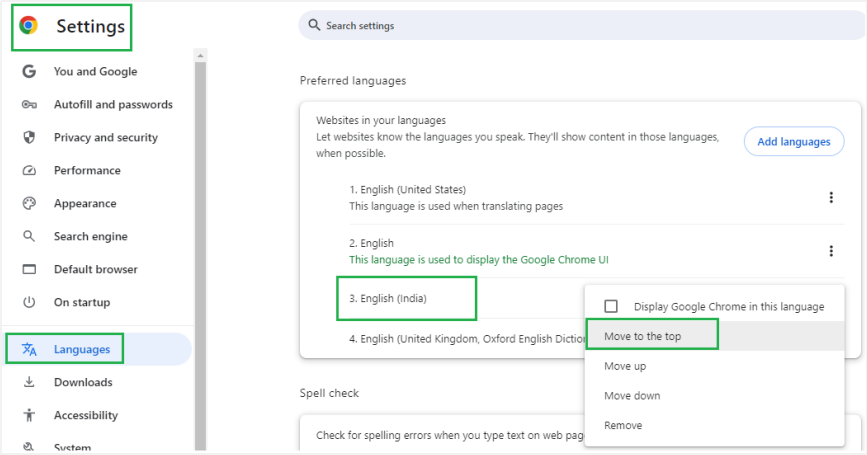
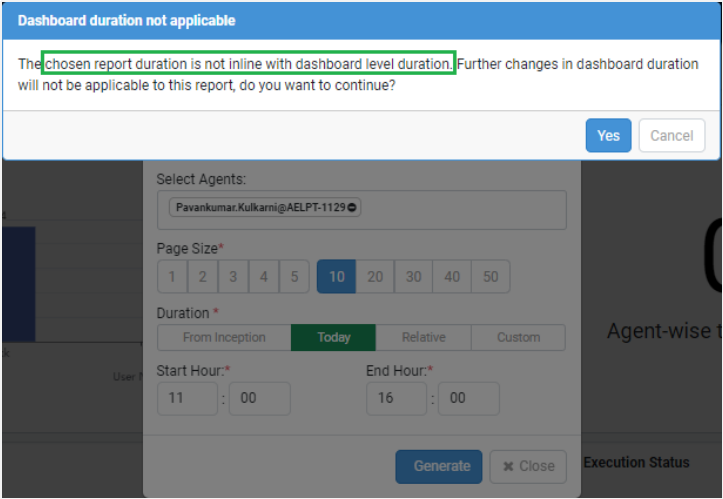
Language settings in Chrome You can apply different durations to the Dashboard and the reports on the Dashboard, if required. However, after you set the durations, changes made to the dashboard duration will not be applied to the report. For example, see the following screenshot:
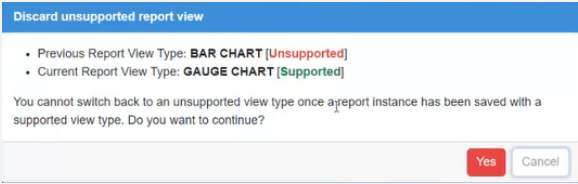
Important: From release version 8.0.0, there are changes in the supported Chart report view type. When you migrate the reports from previous AE version to the current version, then the report will appear as you had generated previously. However, if you update the report view type, then you are asked for confirmation before proceeding with the update. See the following screenshot:
Following is the list of available Reports:
Applicable filters for selecting workflows or categories or agents appear along with the supported durations when you select a report type.
i. Active User Sessions -- Shows the details of users who have logged in at least once during the duration selected for the report.
ii. Active Workflows -- Shows the count of all workflows that are
enabled or active in AE.
Note: You can select multiple workflow or category and agent.
However, the workflows or categories and agents are not considered
when generating the report. Only dashboard or report duration is
considered.
iii. Agent-wise Workflow Average Execution Time - Shows the average time of execution of requests by Agent.
iv. Agent-wise Workflow Execution Status -- Shows workflow execution status such as Execution Started, Complete, failure or unknown by Agent.
v. Agent-wise Workflow Request Report -- It shows the number of completed and failed requests by the Agent.
vi. Agent Utilization Report -- Shows the report details of the agent
availability and utilization in the selected duration.
Recommendation: For best visibility of details, it's recommended
to select a maximum of five (5) agents when generating the report.
vii. Average Daily Agent Utilization -- Shows on a average how much time
did the agent work per day in the given duration. Report time units
will be decided based on dashboard setting.
Notes:
-
The report is duration sensitive, therefore, select either of the following duration tab and provide the details:\
- **Duration 🡪 Relative 🡪 Last 🡪 Days / Months / Years\
- Custom 🡪 Date Range**
-
The average execution duration can be more than 24 hours as an agent can execute multiple threads in a session.
viii. Credential Expiry -- It shows the list of credentials that are
expiring in AE. Specify the start date and end date at the
dashboard level.
NOTE: You can select multiple workflows or categories and
agents. However, the workflows or categories and agents are not
considered when generating the report. Only dashboard or report
duration is considered.
ix. Latest Workflow Execution Status-- It shows the request status for the chosen period.
x. Active Workflows -- It shows the count of all workflows that are enabled or active in AE.
xi. Workflow-wise Profitability -- It shows the profitability for each
workflow. Only the Tenant Admin or a custom role having the
permissions can view the report.
NOTE: Ensure you have defined the ROI for the workflows through
Workflows → ROI Configuration.
Can select multiple workflows or categories, based on selected
workflows or categories and specified duration report is generated.
xii. Status-wise Workflow Operations Report-- It shows the requests ordered by status.
xiii. Success Rate -- Agent -- It shows the total request count against
the agent and the rate of success or failure of the agent's
request. Only the Tenant Admin can view the report.
NOTE: You can select a single workflow or category and agent
only. However, the workflow or category is not considered and only
the selected agent and duration is considered when generating the
report.
xiv. Success Rate -- Platform -- It shows the total request count in
AutomationEdge and the rate of success or failure of the total
requests. Only the Tenant Admin can view the report.
NOTE: You can select multiple workflows or categories and
agents, but not considered when generating reports, only the
duration is considered.
xv. Success Rate -- Workflow -- It shows the total request count for a
workflow and the rate of success or failure of the total requests.
Only the Tenant Admin can view the report.
NOTE: You can select single workflow or category only which is
considered along with duration. Single selection of agent is allowed
but not considered.
xvi. Time Saved Per Workflow -- It shows the workflow wise time saved.
Only the Tenant Admin or a custom role having the permissions can
view the report.
NOTE: Ensure you have defined the ROI for the workflows through
Workflows → ROI Configuration.
Can select multiple workflows or categories, based on selected
workflows or categories and specified duration report is generated.
xvii. Time Saved -- Consolidated -- It shows the consolidated time saved
after executing the workflows.
NOTE: Ensure you have defined the ROI for the workflows
through Workflows → ROI Configuration.
xviii. Top Agents with Errors -- It displays the list of agents with the
most failed requests in a descending order. Only the Tenant Admin
can view the report.
NOTE: Multiple selection of workflows or categories or agent
is allowed, though none of these are considered.
xix. Total Profitability -- It displays the total profitability in card
format. Only the Tenant Admin or a custom role having the
permissions can view the report.
NOTE: Ensure you have defined the ROI for the workflows through
Workflows → ROI Configuration → Workflows.
Single selection of workflow or category is allowed and considered.
Single selection of agent is allowed, but not considered.
xx. Total Request Count -- It displays the count of requests under
various status', such as Complete, Failure, Diverted, Terminated,
and Expired, in addition to the total count of requests.
NOTE: Multiple selection of workflows or categories is allowed
and is considered with duration. Multiple selection of agent is
allowed but not considered.
xxi. Agent-wise total workflow execution time -- Shows the total time
for which the agent(s) was executing any workflow..
Notes: The total execution duration can be more than 24 hours
as an agent can execute multiple threads in a session.
xxii. Profitability Achievement Report -- Shows how much of your target
have you achieved in terms of your profitability goal from this
platform.
Note:
-
Ensure you have defined the ROI for the workflows through Workflows → ROI Configuration → Platform.
-
The report is duration sensitive, therefore, select either of the following duration tab and provide the details:\
- **Duration 🡪 Relative 🡪 Last 🡪 Months / Years\
- Custom 🡪 Date Range**
-
In the gauge report view, in provide the minimum and maximum value. If you select Text Field Value user can enter the details, and if you select Database Column Value the existing target value appears.
xxiii. User-wise Average Execution Time - shows average request execution time for the user.
xxiv. User-wise Execution Report-- It shows the number of completed and failed requests by the user.
xxv. User-wise Request Status Report --It shows the number of requests by the user for request status like New, Execution Started, Complete, failure or unknown.
xxvi. User-wise Workflow Request Report -- Shows report of User requests.
xxvii. Workflow-wise Average Execution Time - Shows average time execution of requests by Workflow.
xxviii. Workflow-wise Result Report--It shows the number of completed and failed requests by request.
xxix. Workflow Average Idle Duration Report-- Shows average idle time for a workflow after it is triggered. It will help understand the load on the system and adding/removing agents based on the information.
xxx. Workflow Execution Summary--It is a report of all execution details of the workflows.
xxxi. Workflow Failure Report - Shows failed workflow requests.
xxxii. Workflow Productivity Report--It compares manual turnaround time
(TAT) with RPA TAT for the workflows. It readily shows the
percentage improvement with RPA.
Note: If the Workflow Productivity Report has to be created
than from ROI Configuration only workflow wise measurement metric
can be used for manually required time field for the release.
xxxiii. Workflows in execution -- Shows the count of workflows that are
currently in execution state.
NOTE: Allows multiple selection of workflows or categories
and agents but none considered.
xxxiv. Running Requests Status - PostgreSQL and Oracle: Shows running requests and their elapsed execution time. Works only for PostgreSQL or Oracle application DB.
xxxv. Running Requests Status -- MSSQL: Shows running requests and their elapsed execution time. Works only for MSSQL application DB.
The following section explains one of the reports in detail,
Workflow Productivity Report
It compares manual turnaround time (TAT) with RPA TAT for the workflows. It readily shows the percentage improvement with RPA. Following is a sample 'Workflow Productivity Report' snapshot. The table below describes the columns.
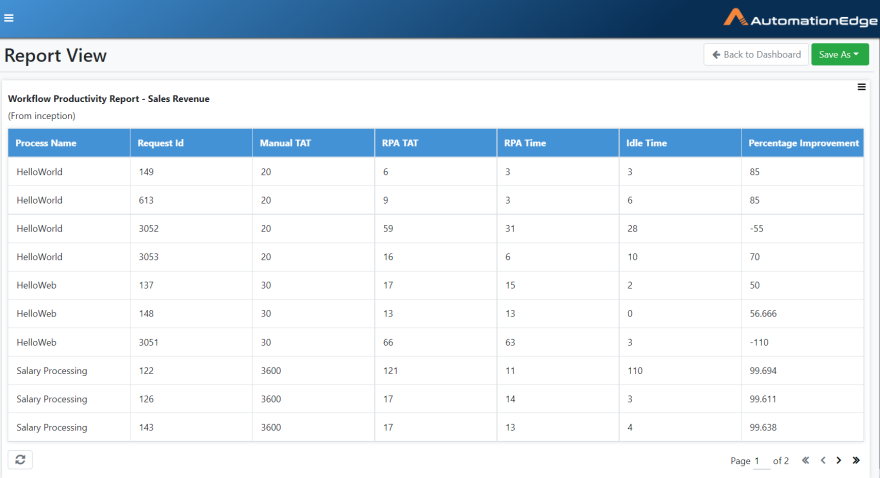
Figure 14.4: Workflow Productivity Report
Table 14.1: Workflow Productivity Report Description
| No. | Column | Description |
|---|---|---|
| 1 | Process | The name of the AutomationEdge workflow |
| 2 | Request Id | The workflow execution Request Id |
| 3 | Manual TAT* | Manual execution time (in seconds) specified while configuring a workflow |
| 4 | RPA TAT* | The total time taken by a workflow to complete execution (RPA Time |
| 5 | RPA Time | Actual time (in Seconds) taken for the request to complete once the Agent has picked it up |
| 6 | Idle Time | The timespan (in Seconds) between submitting a request and the Agent picking it up for execution |
| 7 | Percentage Improvement | It is the Improvement in terms of TAT as compared to manual execution |
*TAT => Turn Around Time
Custom Reports
The need for custom reports typically arises when there is a need to assimilate AutomationEdge data and customer's business data. We recommend maintaining a separate schema for custom reports. The users need to create and manage the schema containing the customer's business data and AutomationEdge data preferably exposed as views.
AutomationEdge provides two features, Datasources and Templates, to create and manage custom reports. Datasource is the schema to fetch the report data. Templates define the layout of the report; it includes the data to fetch from the Datasource and the report format.
Template creation permission to create tenant-specific and workflow specific templates is available to Admins and Workflow Administrators, respectively. Tenant users can use these templates for creating reports.
The following sections describe Datasources and Templates.
Datasources (for custom reports)
AutomationEdge needs to connect to an external database to fetch data for Custom Reports. The Datasources sub-menu provides options to Add, Update or Delete Datasources.
New Datasource
To create a new data source,
-
Navigate to the Reports menu and the Datasources sub-menu.
-
Click the New Datasource button
Figure 14.5: Create New Datasource
- Provide details as shown in the image below and described in the table underneath the Datasource Type. Click Create. Test Connection successful message is displayed.
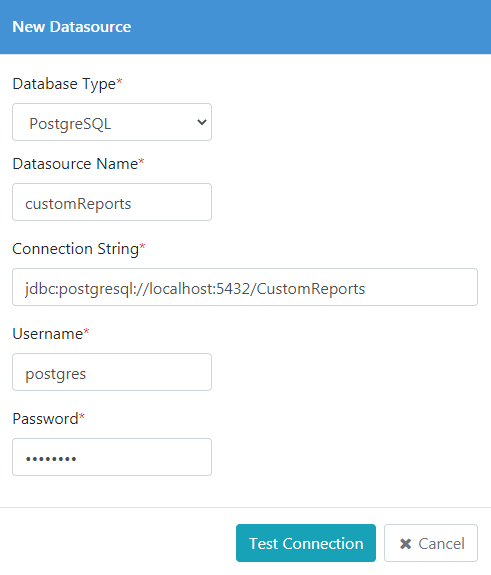
Figure 14.6: Create New Datasource
The following table describes the fields for Datasource creation.
Table 14.2: Datasource fields
| Field | Description |
|---|---|
| Name | Provide a name for the Datasource |
| Connection String | Provide a jdbc connection string to the database (e.g. jdbc:postgresql://localhost:5432/CustomReports, assuming you have the database on the same machine as the AutomationEdge server, else replace with the ip address). |
| Username | Provide database username |
| Password | Provide password |
| Datasource Type | Select a Datasource Type from the dropdown list. |
- A 'Dashboard created successfully' message displays.
Update Datasource
To update a new data source,
-
Click the Reports menu and the Datasources sub-menu.
-
From the list of Datasources, click edit in the Actions column for the Datasource to be updated.
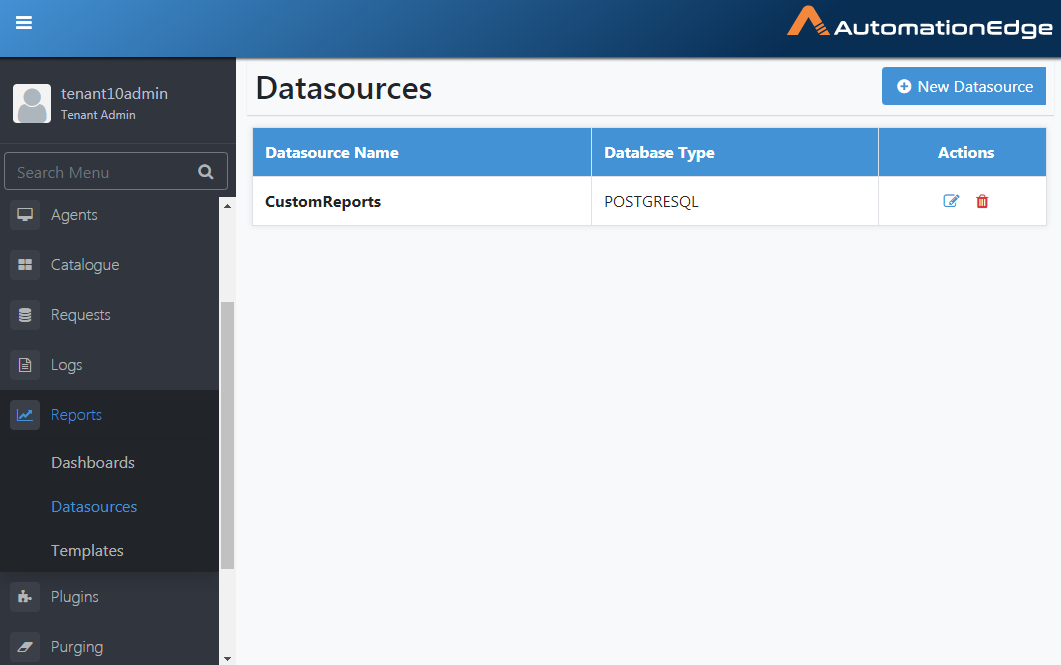
Figure 14.7: Edit Datasource
- The Update Datasource window opens as shown below. The Datasource is unmodifiable. Make the required changes to any of the other attributes. Click Update. Click Test Connection.
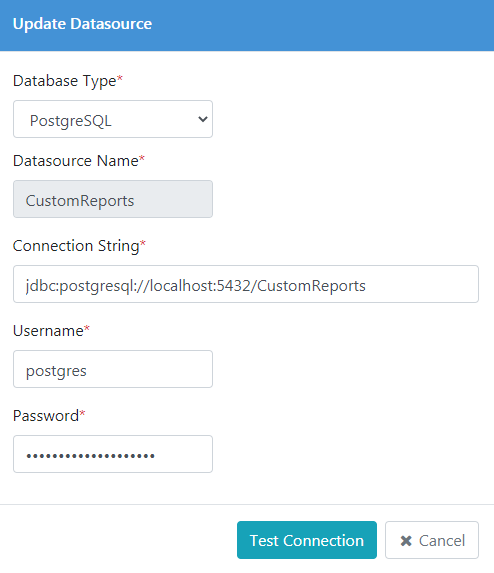
Figure 14.8:Update Datasource
- Test Connection Successful message appears. Click Update.
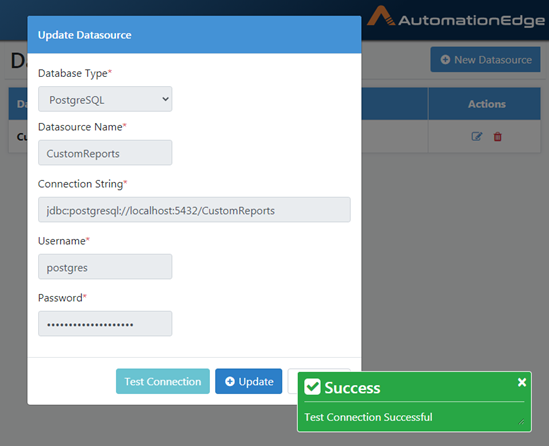
Figure 14.9: Test Connection Successful
- A Datasource updated successfully message displays.
Templates (for custom reports)
Define Templates by specifying a database query, the desired attributes and the desired format for generating reports. There are three types template options available to you to create a custom report. The template types are: Classic template, Flat Query template, and Structured Query template.
Classic template using JSON Based approach
To create a new classic template using JSON Based approach,
- Click on the Reports menu and Template sub-menu. Click New Template.
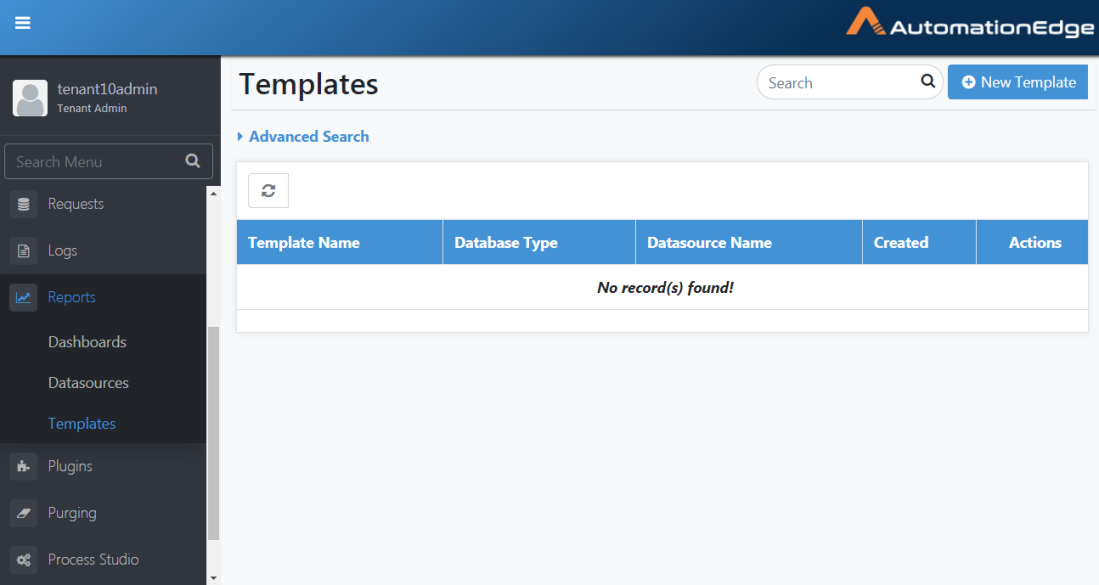
Figure 14.10: Template Menu
- The New Template wizard appears. Enter the details in the Template Details page.
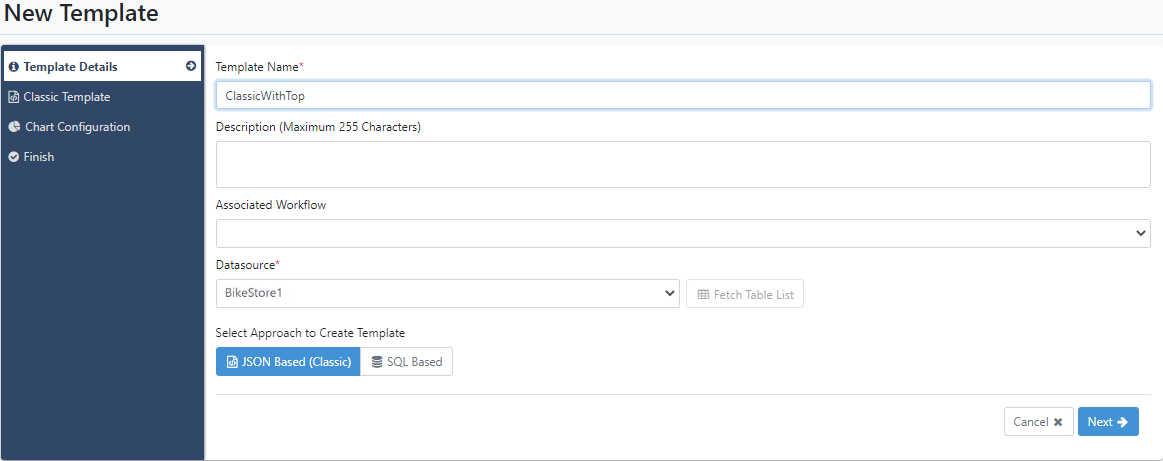
Figure 14.11: New Template page
| Field | Description |
|---|---|
| Template Name | Provide a Template name. This field is mandatory. |
| Description | Provide a Template description |
| (Maximum 255 Characters) | |
| Associated | Select an associated workflow. If selected, only |
| Workflow | users with permission to the workflow will have |
| access to the template. And this report will be | |
| specifically for data of that workflow. | |
| Datasource | Select an existing Datasource from the list. |
| This field is mandatory. | |
| NOTE: To get list of tables, click **Fetch | |
| Table Lists**, which is available only after you | |
| select the data source. However, use the table | |
| details only for creating the **Structured Query | |
| Template**. |
- After filling the details, click JSON Based (Classic) under Select Approach to Create Template. In the Classic Template page, the report placeholder template query is generated.
Note: As the generated template query is a placeholder and not a working JSON query, you must modify the query to achieve the required result.
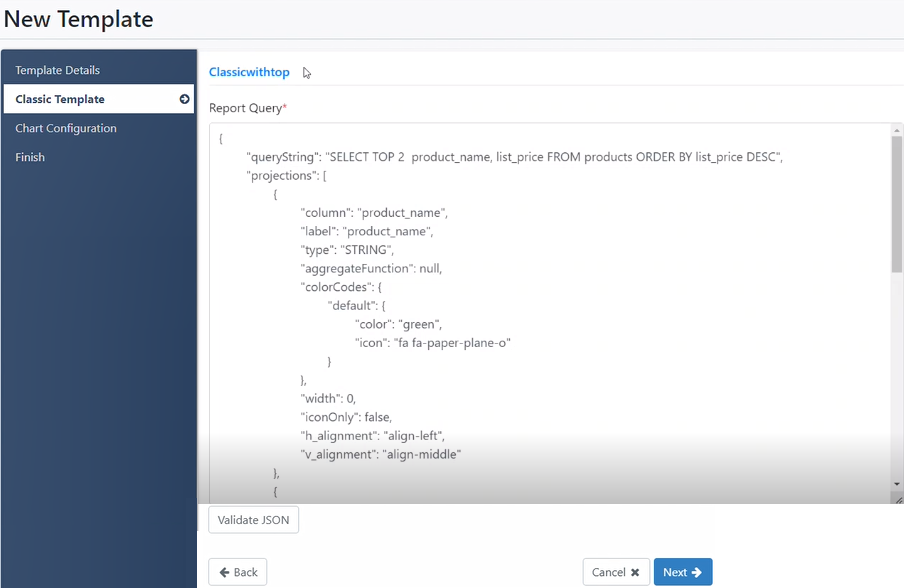
Figure 14.12: JSON Based (Classic) report query
-
Click Validate JSON. The validation is successful message appears.
-
Click Next. The Chart Configuration page appears.
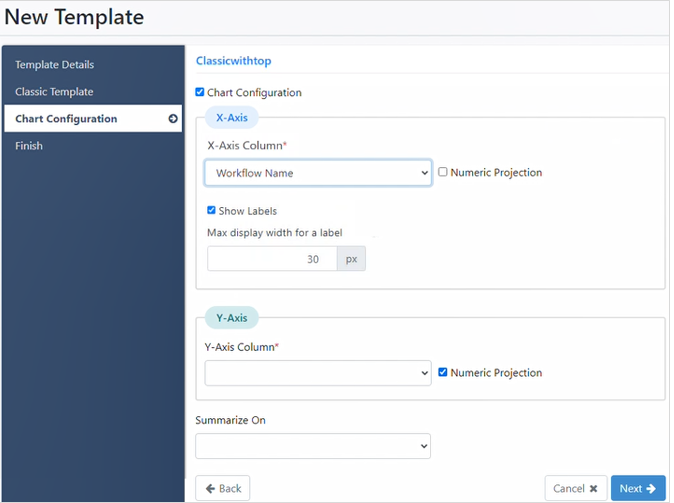
Figure 14.13: Chart Configuration
| Chart | Select the checkbox to select the axis details. |
| Configuration | |
|---|---|
| X-Axis Column | Select the field that will be the X-axis. |
| NOTE: Select the Numeric Projection checkbox, if the column value data type is numeric. | |
| Show Labels | Select the checkbox to display the labels as available in the projections. |
| Maximum Display width for a label | Set the character display limit for label in pixels. |
| For example, if the pixel is 30, then characters after 30 pixels will be truncated in the view. | |
| Y-Axis Column | Select the field that will be the Y-axis. |
| NOTE: Select the Numeric Projection checkbox, if the column value data type is numeric. | |
| Summarize On | Select the field based on which the chart details will be summarized. |
- After selecting the chart configuration details, click Next. The Finish page appears.
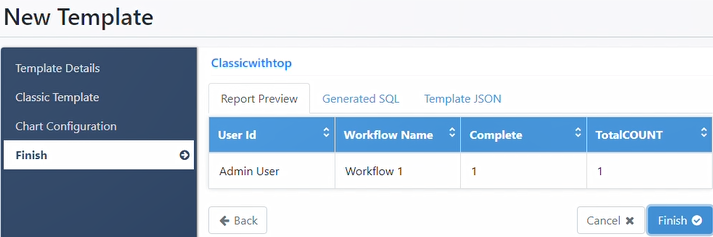
Figure 14.14: Finish page view
- On the Finish page, click each of the following tabs:
-
Report Preview: Displays the preview of the report based on the columns called in the SQL query.
-
Generate SQL: Displays the generated SQL query for a template.
-
Template JSON: Displays the complete report template JSON preview.
- Click Finish. The template appears in the Template page.
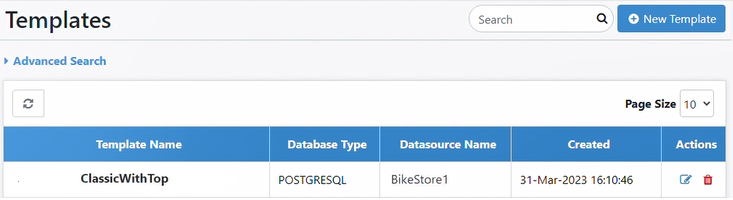
Figure 14.15: Templates page view
NOTE: The template appears in the Dashboard, which you can use to generate reports.
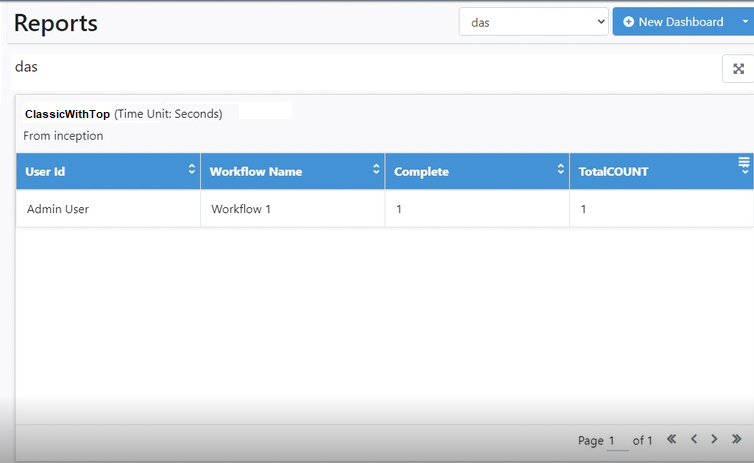
Figure 14.16: Report on the Dashboard
Flat Query template using SQL Based approach
To create a flat query template using SQL Based approach,
-
Click on the Reports menu and Template sub-menu. Click New Template.
-
The New Template wizard appears. Enter the details in the Template Details page.
NOTE: For field details, see Classic template using JSON Based approach.
- After filling the details, click SQL Based under Select Approach to Create Template. The SQL Query menu appears in the left-pane.
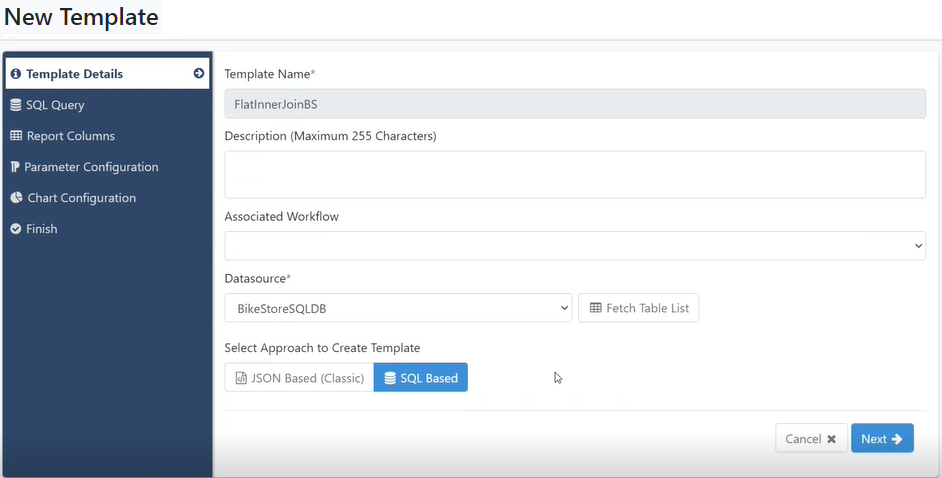
Figure 14.17: SQL Query
- Click Next. The SQL Query page appears.
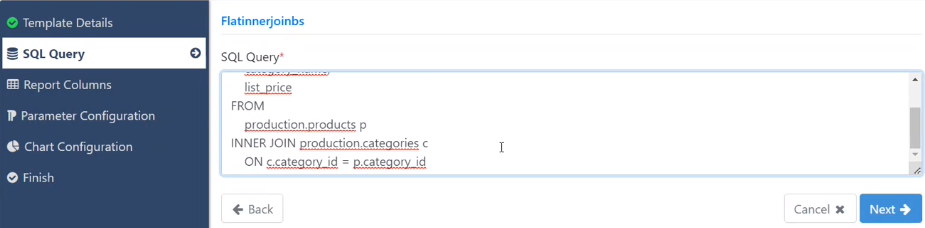
Figure 14.18: SQL Query page
- In SQL Query, enter the query, which is tested, and then click Next. The Report Columns page appears.
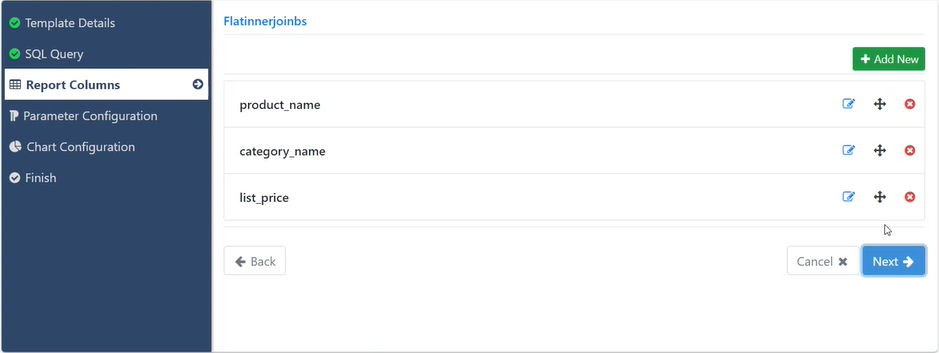
Figure 14.19: Report Columns page
NOTE: If the SQL Query's select statement contains '*', that is, all columns, then you need to add the projection columns manually using Add New in the Report Columns page.
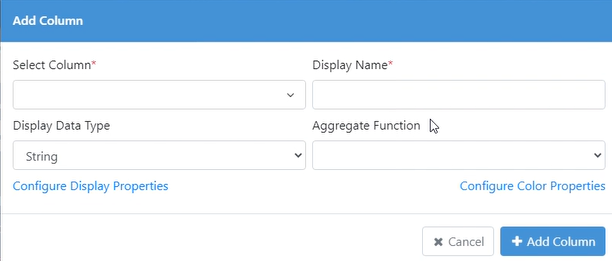
Figure 14.20: Add Column dialog
-
Enter the following details:
-
Select Column: Select the name of the column, as called out in the SQL query.
-
Display Name: Enter the column name, as you want it to appear in the report.
-
Display Data Type: Select the data type of the selected column.
-
Aggregate Function: Select the aggregate function used for the selected column. For example, COUNT, AVERAGE, and so on.
-
-
Click Configure Display Properties, to set the horizontal and vertical text alignment and the width of the columns, as you want to appear in the report.
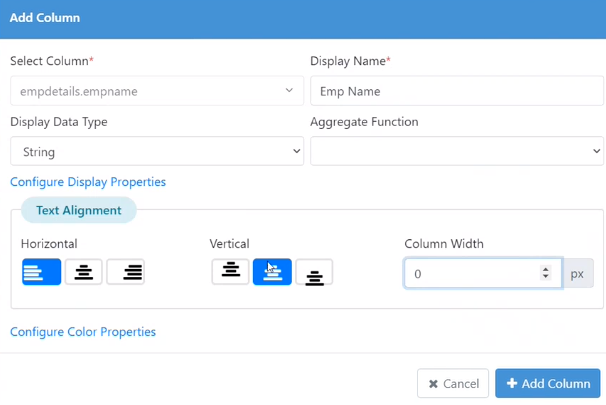
Figure 14.21: Add Column dialog: Configure Display Properties
- Click Configure Color Properties, to set the colors for values of columns, as required.
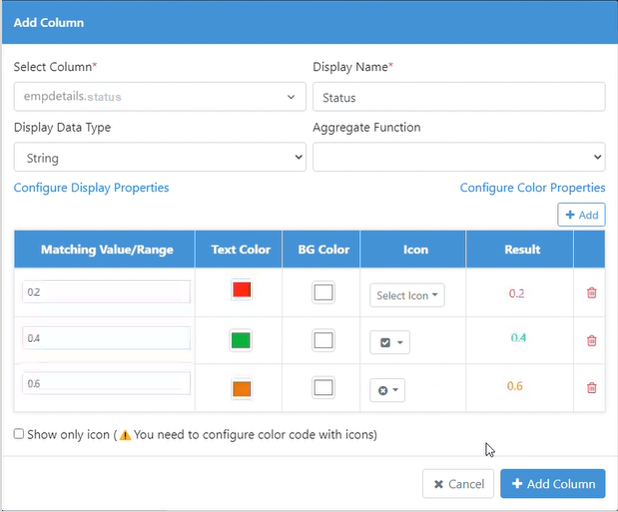
Figure 14.22: Add Column dialog: Configure Color Properties
-
Click Add. A new row appears.
-
Enter the following details:
-
Matching Value/Range: Enter the name of the value or range that when matched will change the color of the text in the report.
-
Text Color: Select the text color of your choice.
-
BG Color: Select the background color, if required.
-
Icon: Select the icon that you want to assign with the text.
-
Result: Displays the text and the icon associated with the text.
-
-
Click Add Column. The column appears in the Report Columns page.
- In the Reports Column page, in addition to adding new columns, if required, you can perform any of the following tasks:
-
To view the actual JSON details for a projection column, click on the column name and expand the view.
-
To modify the column details, click Edit. The Update Column dialog appears.
-
To sort the columns, click Move (
 ), and then drag-and-drop the column to the
location of your choice.
), and then drag-and-drop the column to the
location of your choice. -
To delete the column, click Remove.
- Click Next. The Parameter Configuration page appears.
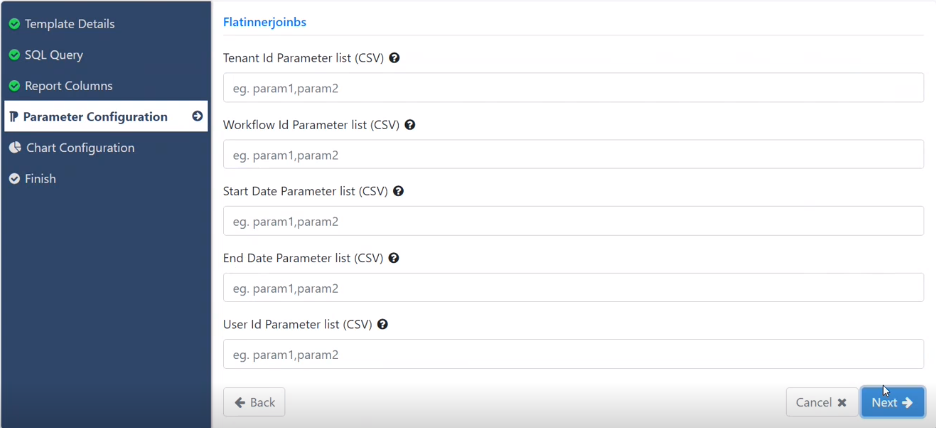
Figure 14.23: Parameter Configuration page
| Tenant Id Parameter list (CSV) | Enter the name of the tenant ID parameter list. Note: For both, SQL Based and Wizard based approach, it specifies a list of parameter names for tenant ids (e.g. [“param1”, “param2”]. AE engine identifies these parameters in the query. These parameters should be present in the query as ‘:param1’ and ‘:param2’. It substitutes these query parameters by run time values of the tenant id of the user running the report. This parameter value in the query table should be numeric. |
| Workflow Id Parameter list (CSV) | Enter the name of the workflow ID parameter list.Note: Only for SQL Based approach, it specifies a list of parameter names for workflow ids. AE engine identifies these parameters in the query. It substitutes these query parameters with run time values. This parameter value in the query table should be numeric. |
| Start Date Parameter list (CSV) | Enter the name of the start date parameter list.Note: Only for SQL Based approach, it specifies a list of parameter names for the start date. AE engine identifies these parameters in the query. AE engine substitutes these query parameters by the start date-time stamp of the report. This parameter value in the query table should be of type date. |
| End Date Parameter list (CSV) | Enter the name of the end date parameter list.Note: Only for SQL Based approach, it specifies a list of parameter names for the end date. AE engine identifies these parameters in the query and substitutes these query parameters by the end date-time stamp of the report. The parameter value in the query table should be of type date. |
| User Id Parameter list (CSV) | Enter the name of the user Id parameter list.Note: For both, SQL Based and Wizard based approach, it specifies a list of parameter names for user ids (e.g. [“param1”, “param2”]). AE engine identifies these parameters in the query. These parameters should be present in the query as ‘:param1’ and ‘:param2’. It substitutes these query parameters by the run time values of the user id running the report.If Tenant users execute a custom report with the userIdParamNames option, the user can see rows that contain his user id.However, if Admins execute a custom report with the userIdParamNames option, the user can see all rows for the first (i.e. oldest created) 1000 users. This parameter value in the query table should be numeric. |
- Click Next. The Chart Configuration page appears.
NOTE: For Chart Configuration field details, see Classic template using JSON Based> approach.
- Click Next. The Finish page appears.
NOTE: For details about the three tabs, see Classic template using JSON Based approach.
- Click Finish. The template appears in the Template page.
NOTE: The template appears in the Dashboard, which you can use to generate reports.
Wizard Based Structured Query template
-
Click on the Reports menu and Template sub-menu. Click New Template.
-
The New Template wizard appears. Enter the details in the Template Details page.
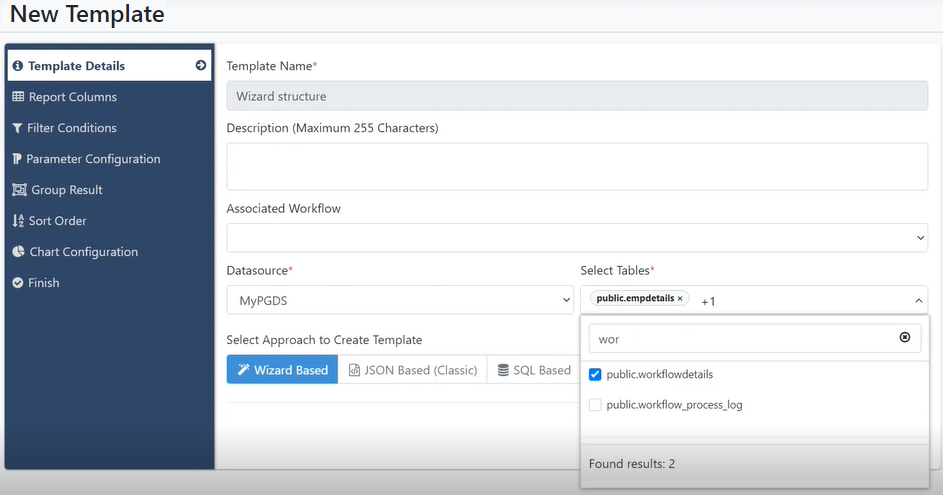
Figure 14.24: Template Details page
| Field | Description |
|---|---|
| Template Name | Provide a Template name. This field is mandatory. |
| Description (Maximum 255 Characters) | Provide a Template description |
| Associated Workflow | Select an associated workflow. If selected, only users with permission to the workflow will have access to the template. And this report will be specifically for data of that workflow. |
| Datasource | Select an existing Datasource from the list. This field is mandatory.NOTE: To get list of tables, click Fetch Table Lists, which is available only after you select the datasource. |
| Select Tables | Select the tables you want to add to the query.NOTE: When you select the tables from the list of available tables, the Wizard Based option appears. |
- Click Next. The Report Columns page appears.
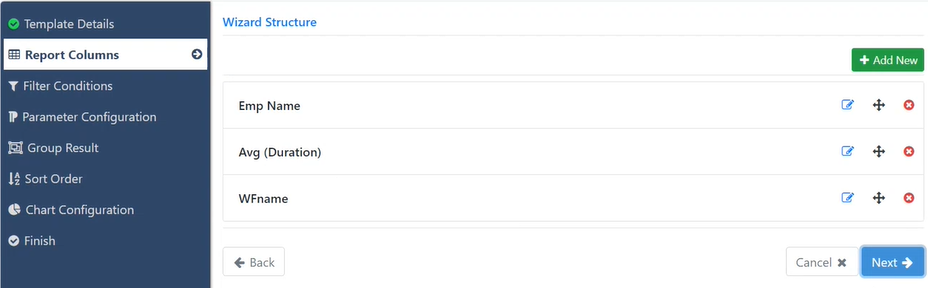
Figure 14.25: Report Columns page
-
In the Report Columns page, you can perform the following tasks, if required:
a. Click Add New, to add new columns.
b. Click Edit, to modify the column details.
c. Click Move, to sort the columns on the page.
d. Click Remove, to delete the column.
NOTE: For details about the tasks, see Flat Query template using SQL Based approach.
- Click Next. The Filter Conditions page appears.
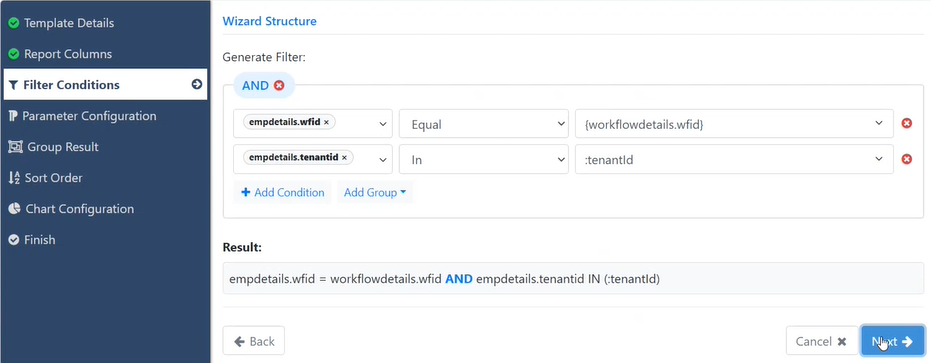
Figure 14.26: Filter Conditions page
-
In the Filter Conditions page:
a. Click Add Group. From the list, select the grouping option, AND or OR.
b. Click Add Condition, and select the filter condition, the comparator, and the mapped column. The filter conditions are captured in the Result field.
-
Click Next. The Parameter Configuration page appears.
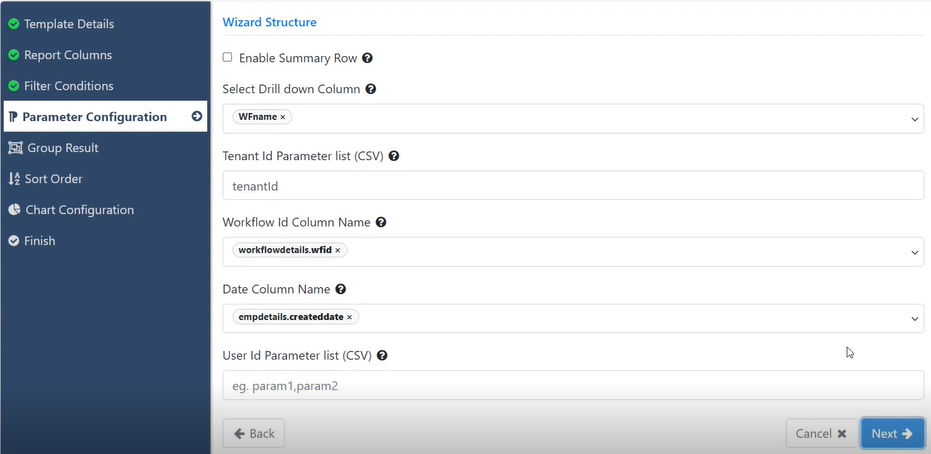
Figure 14.27: Parameter Configuration page
- Enter the following field details:
| Field | Description |
|---|---|
| Enable Summary Row | Select the checkbox if you want the summary row in the report.Note: Only for structured query, a boolean value specifying if the summary row should be present for the report or not. |
| Select Drill down Column | Select the column on which you want to drill down.Note: Only for structured query, if the report needs to have a feature where clicking on row drills down further, the user has to populate this field with the column's name to use for further grouping. This name must be present in projections. |
| Tenant Id Parameter list (CSV) | Enter the name of the tenant ID parameter list. Note: For both, SQL Based and Wizard based approach, it specifies a list of parameter names for tenant ids (e.g. [“param1”, “param2”]). AE engine identifies these parameters in the query. These parameters should be present in the query as ‘:param1’ and ‘:param2’. It substitutes these query parameters by run time values of the tenant id of the user running the report. This parameter value in the query table should be numeric. |
| Workflow Id Column Name | Select the workflow ID column name. Note: For structured query only, this parameter can be present only if workfoIdParamNames is not present. This parameter has the workflow id column on which the engine adds a workflow id filter. |
| Date Column Name | Select the date column name. Note: Only for structured query, this parameter can be present only if startDateParameterNames and endDateParamNames are not present. This parameter has the name of the column on which the engine adds the date filter. This parameter value in the query table should be of type date. |
| User Id Parameter list (CSV) | Enter the name of the user Id parameter list.Note: For both, SQL Based and Wizard based approach, it specifies a list of parameter names for user ids (e.g. [“param1”, “param2”]). AE engine identifies these parameters in the query. These parameters should be present in the query as ‘:param1’ and :param2’. It substitutes these query parameters by the run time values of the user id running the report.If Tenant users execute a custom report with the userIdParamNames option, the user can see rows that contain his user id. However, if Admins execute a custom report with the userIdParamNames option, the user can see all rows for the first (i.e. oldest created) 1000 users. This parameter value in the query table should be numeric. |
- Click Next. The Group Result page appears.
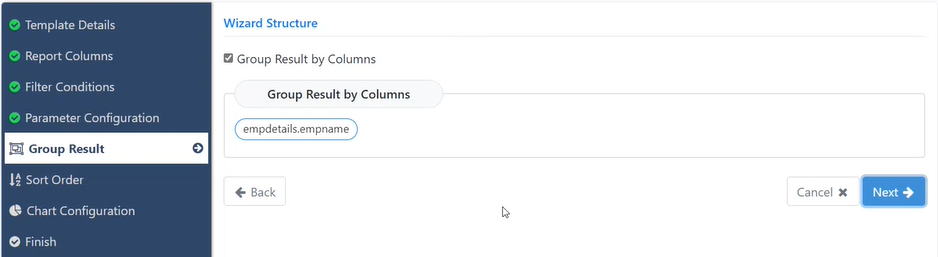
Figure 14.28: Group Result page
- Select the Group Result by Columns checkbox. The group by columns appear in Group Result By Columns.
Note:
Group by columns are selected based on report columns (projections) and aggregate functions used on the columns. Number of group by columns also depend on configured parameters. If the inner Query column name is configured, then group must have only one column, therefore, the user needs to remove some of the group by columns.
To remove some of the group by columns, hover over the column, and then click Remove column that appears.
- Click Next. The Sort Order page appears.
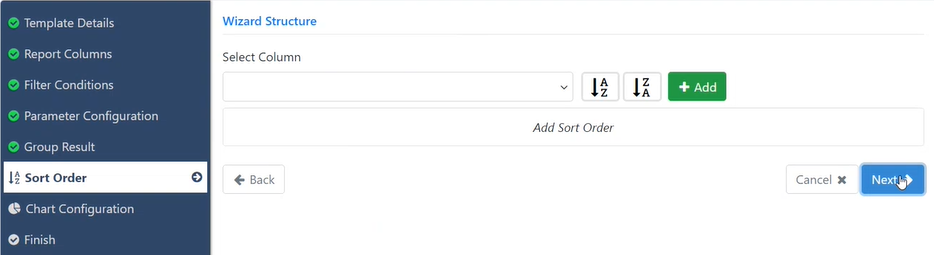
Figure 14.29: Sort Order page
-
Select a column by which you want to sort the data, and then click either, A-Z or Z-A for ascending or descending sorting order, respectively.
-
Click Add to add the selected column to the sort order list.
-
Click Next. The Chart Configuration page appears.
NOTE: For Chart Configuration field details, see Classic template using JSON Based approach.
- Click Next. The Finish page appears.
NOTE: For details about the three tabs, see Classic template using JSON Based approach.
- Click Finish. The template appears in the Template page.
NOTE: The template appears in the Dashboard, which you can use to generate reports.
Email Reports
View reports on dashboards and download as PDF/CSV. Configure schedules for reports in PDF/CSV format to be emailed as a zip file to specified email addresses, as per the timezone set on the Email Reports menu. This feature is available only after configuring SMTP for the tenant.
Note: This option generates and emails reports with the first 10000 records.
Following are the steps to configure Email Reports,
-
Navigate to the Reports🡪Email Reports menu.
-
Click Add New button on the top right corner.
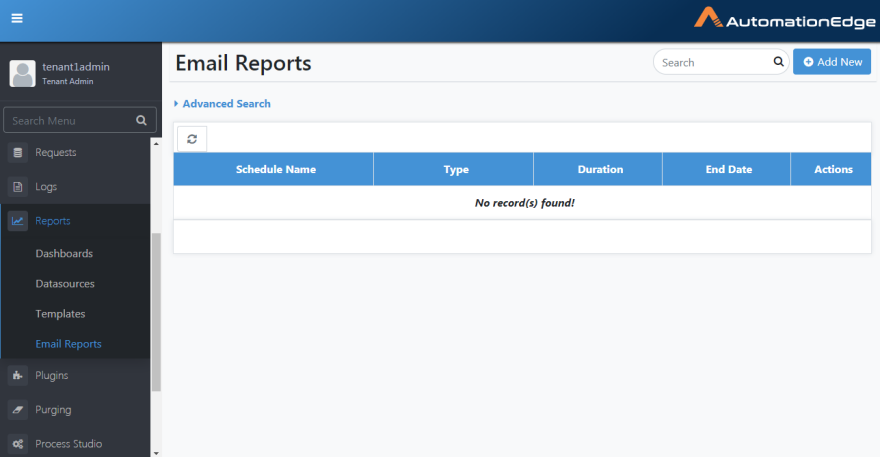
Figure 14.30: Email Report Schedules
- The Add Email Reports Schedule page appears as seen below.
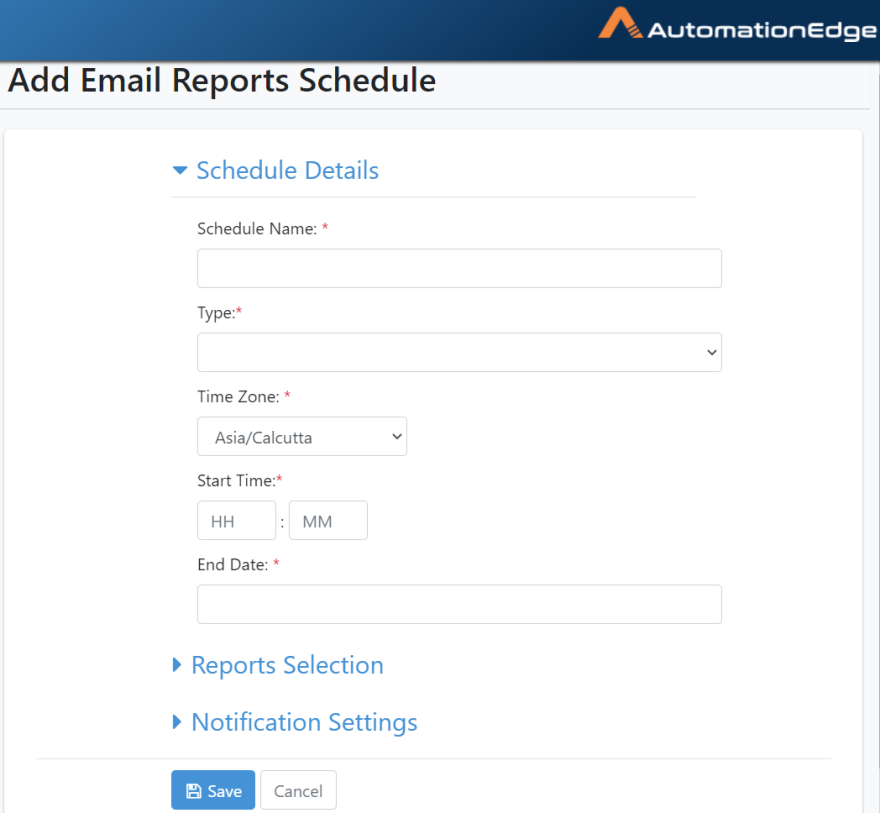
Figure 14.31: Add New Email Report Schedule
- Provide a Schedule name and choose a Schedule Type from the drop-down list.
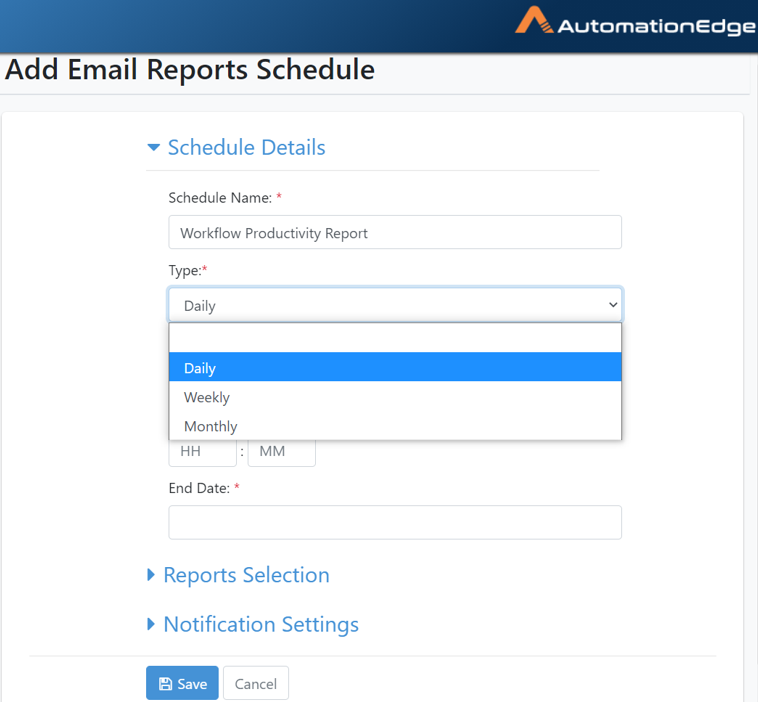
Figure 14.32: Schedule Type
- If the Type chosen is Daily for sending the reports by email, specify the Start time (HH:MM format) and an End Date.
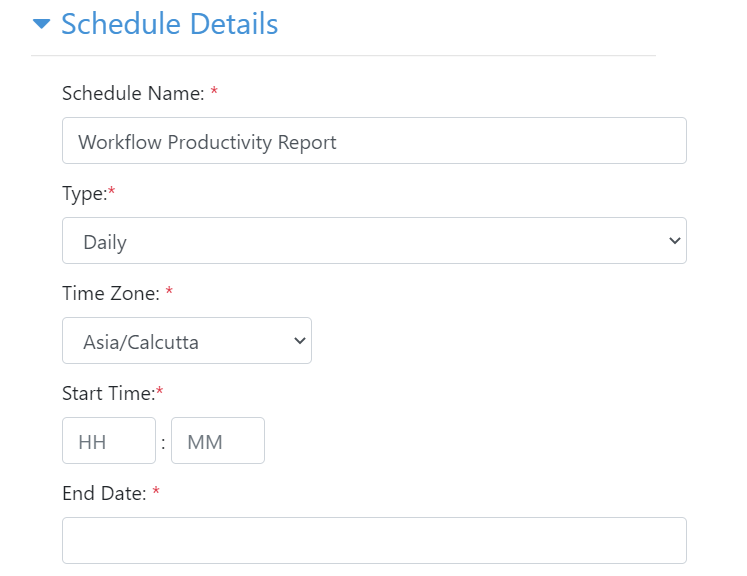
Figure 14.33: Daily Schedule Configuration
- If the Type selected is Weekly for sending the reports by email, specify the Day of Week, a Start time (HH:MM format) and an End Date.
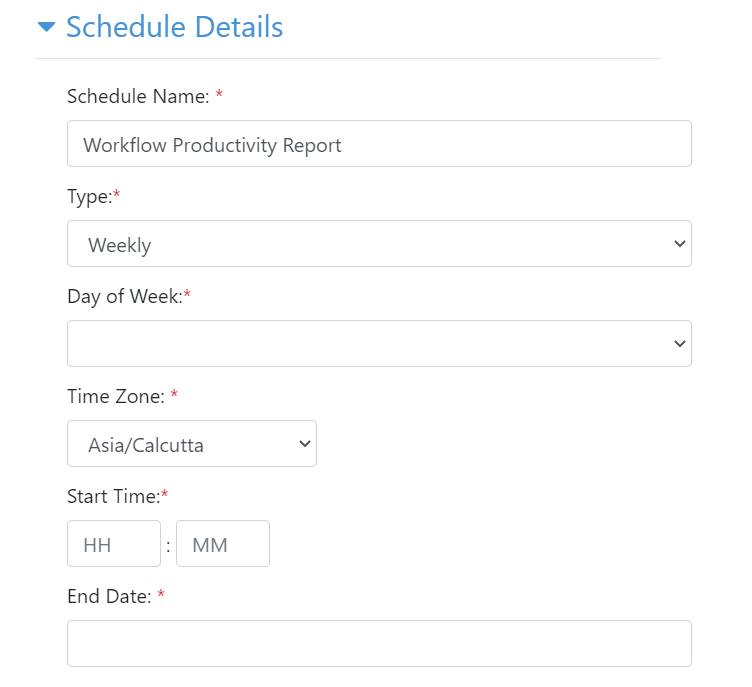
Figure 14.34:Weekly Schedule Configuration
- If the Type chosen is Monthly for sending the reports by email, specify the Criteria, a Start time (HH:MM format) and an End Date.
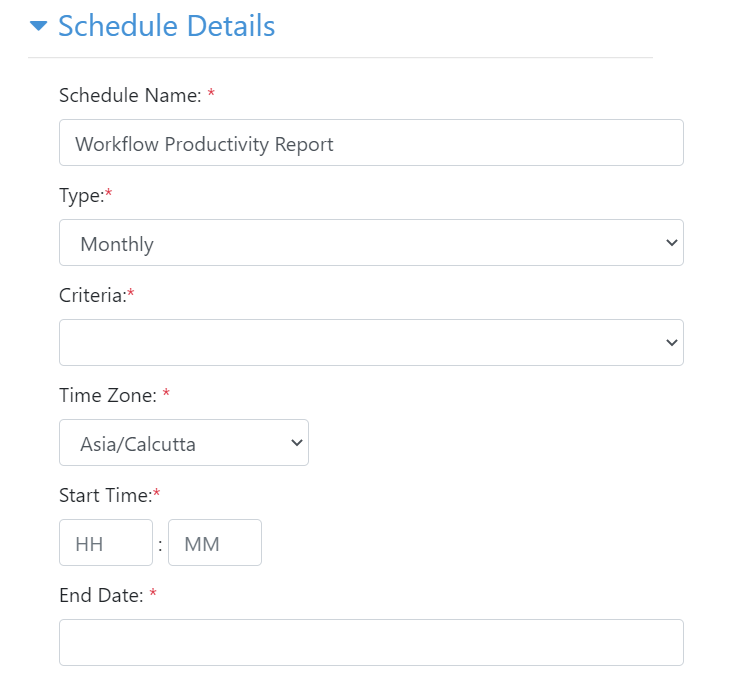
Figure 14.35:Monthly Schedule Configuration
- Choose a Criteria from the below -- Day of Month or Day of Week.
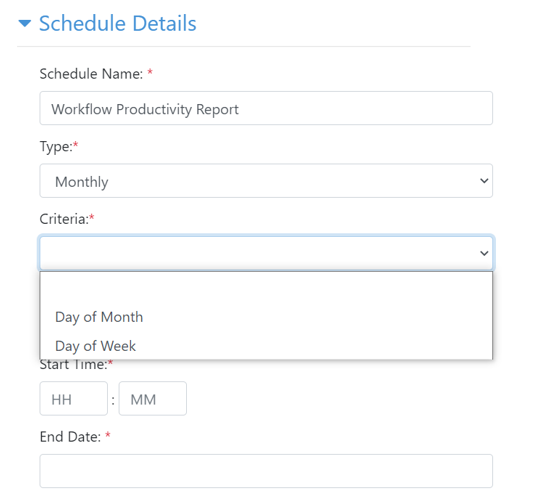
Figure 14.36: Select Monthly Schedule Criteria
- For Day of Month, provide a Day of Month by scrolling the scroll bar in the field to increment or decrement the values.
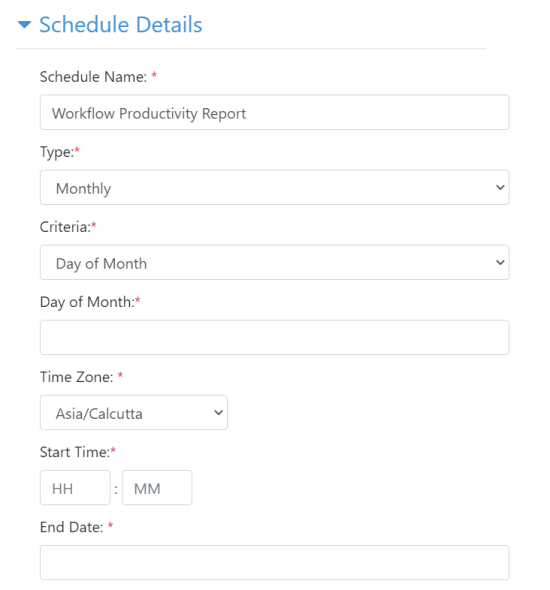
Figure 14.37: Select Day of the Month
- If Day of Week is chosen in criteria, provide Day of Week and Weekday of Month. Day of the week can be Sunday-Saturday, and Weekday of Month can be First, Second, Third, Fourth or Last. (e.g.
-
Every last Friday of the Month at 7 PM, or
-
every First Monday at 8 AM, or
-
on every 4^th^ day of the Month at 7 AM or
-
last day of the Month at 9 PM)
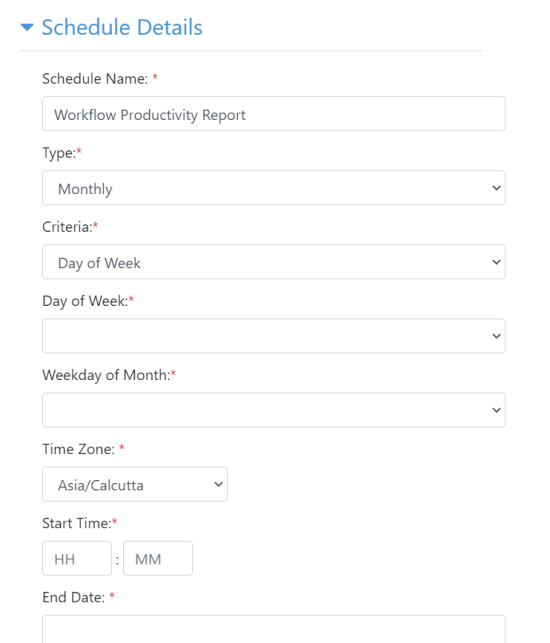
Figure 14.38:Select Day of the Week
-
The user's (browser) time zone populates by default. Users can change the time zone if needed.
-
Select a Time Zone from the list. AutomationEdge server will generate and email the report at the local time according to the time zone specified.
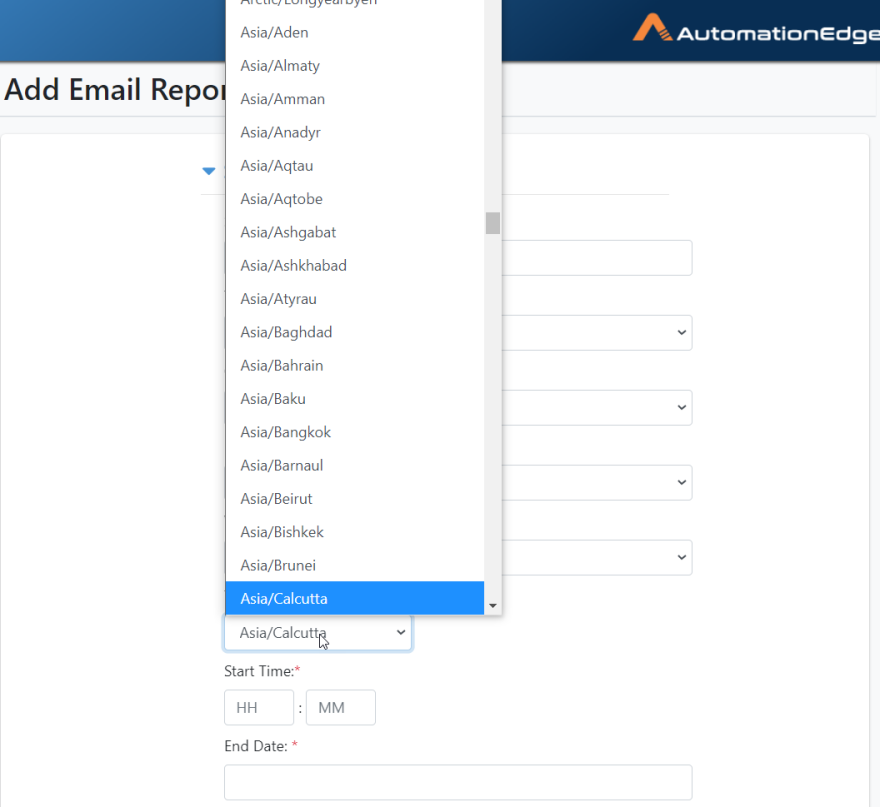
Figure 14.39: Select Time Zone
- Create a Daily Email Reports Schedule with Schedule details as below.
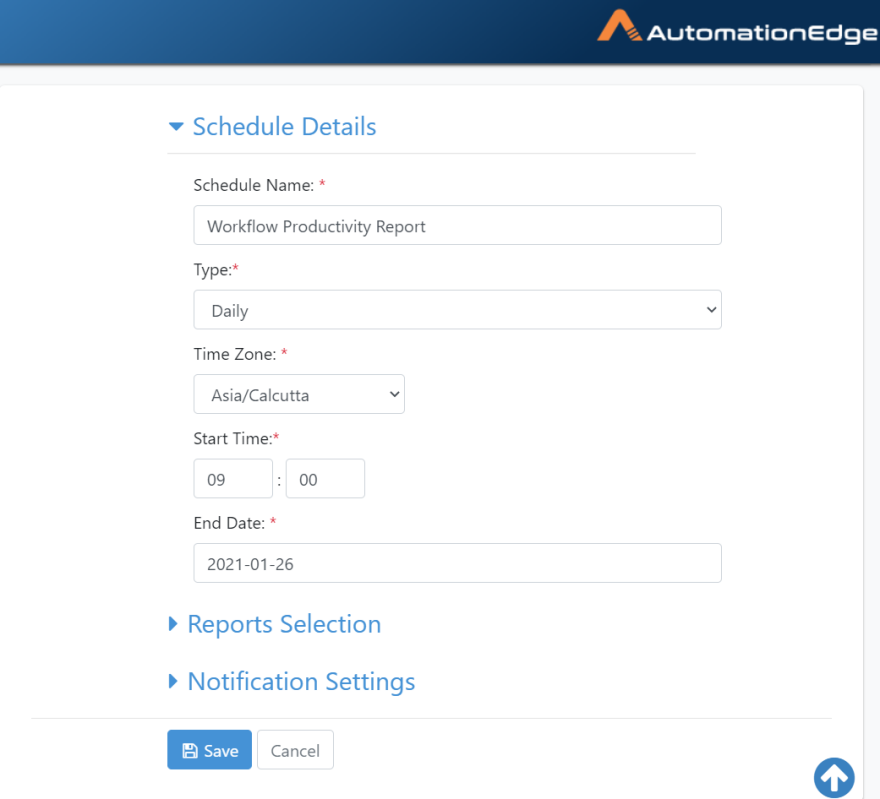
Figure 14.40: A Daily Schedule
- Next, go to the Reports Selection section.
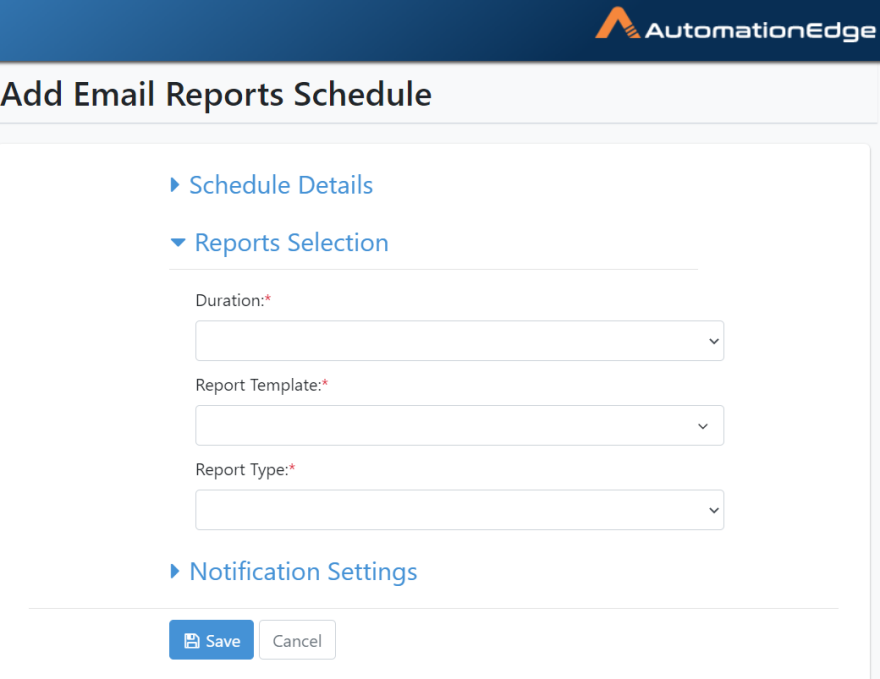
Figure 14.41: Reports Selection
- In the Duration, field select the cumulative period data to be included in the report. It has the following options -- Daily, Weekly, Monthly or Quarterly.
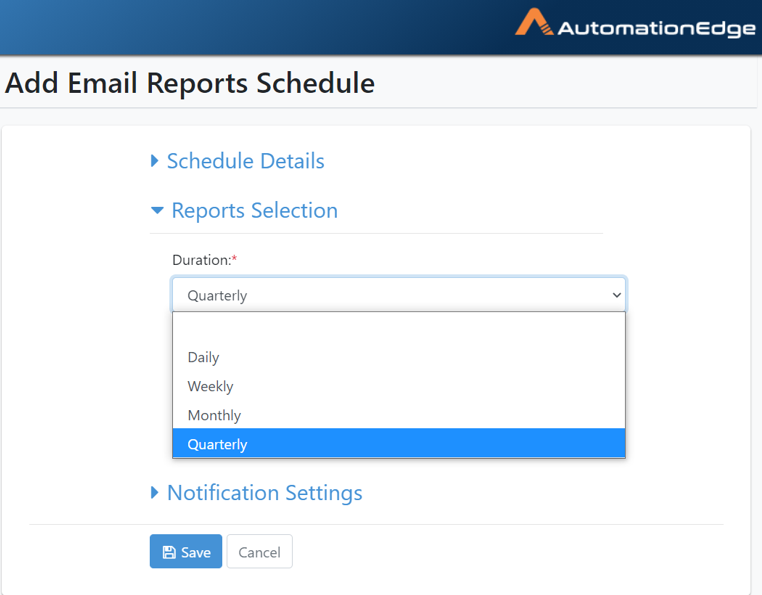
Figure 14.42: Report Data Duration
- Select one or multiple Report Templates by enabling the checkbox next to the reports.
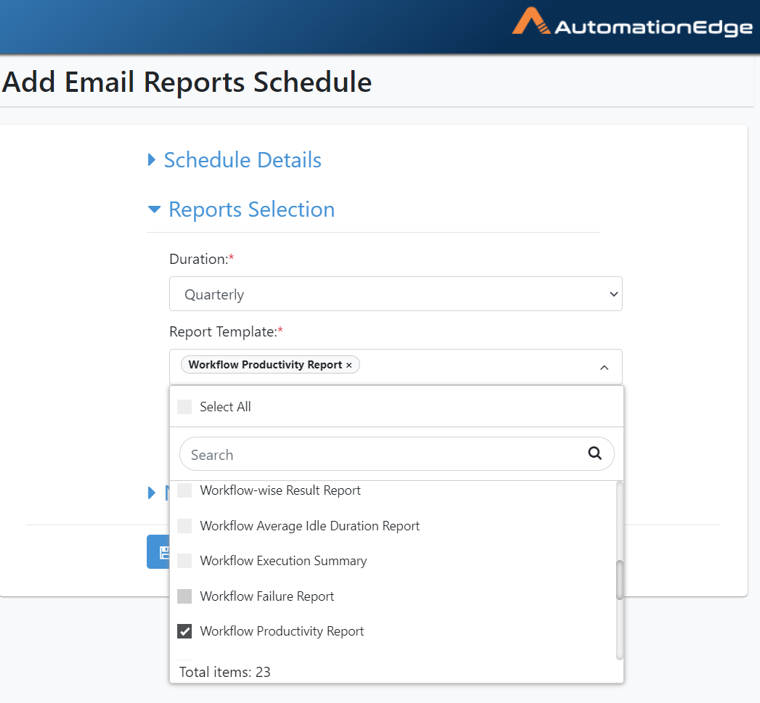
Figure 14.43: Select Report Template
- Select a Report Type from the list. Choose from CSV/PDF.
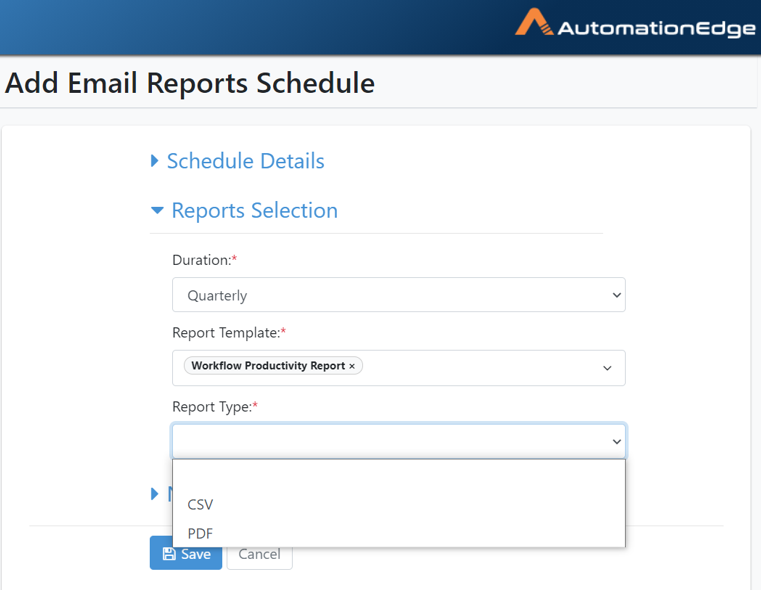
Figure 14.44: Selected Report Template
- In this case, select CSV.
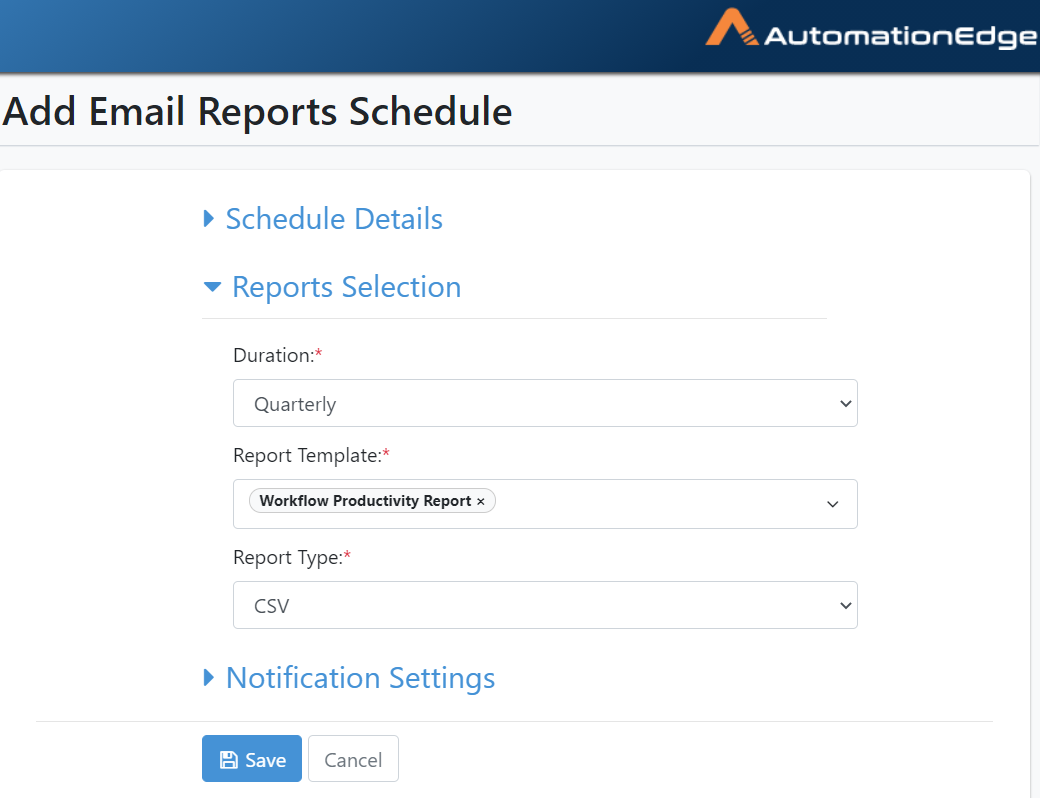
Figure 14.45: Selected Report Type
-
Next, expand the Notification section.
-
Similar to the Notification feature, the following are the options to select the senders,
-
By Roles (select the list of roles like tenant admin/WF admin)
-
By Users (selecting the list of users)
-
Providing the email addresses
- Provide Email list entries and Press <Enter> or <Comma> key to add to the Email List. Click Save.
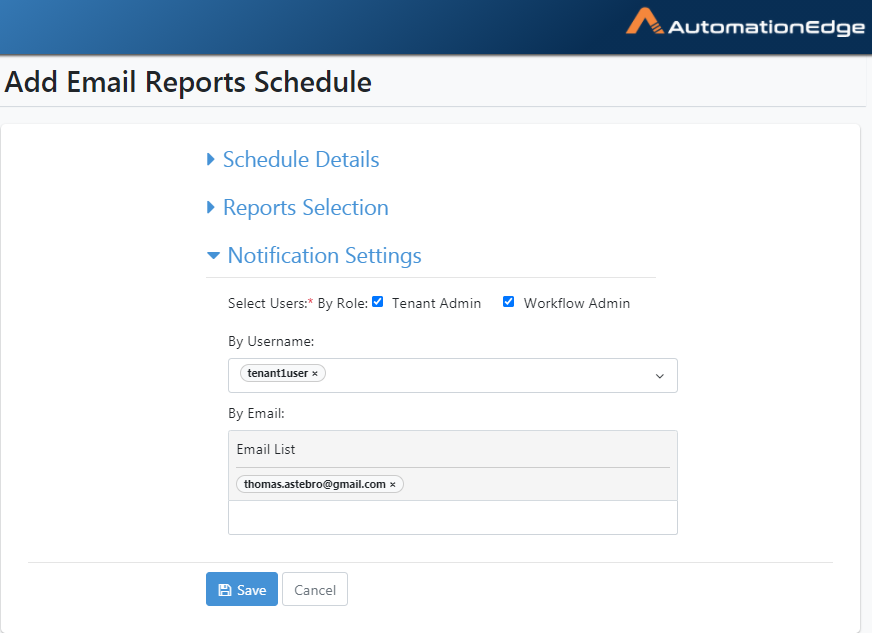
Figure 14.46: Notification Settings
- The 'Email Reports Schedule' is now visible in the list.
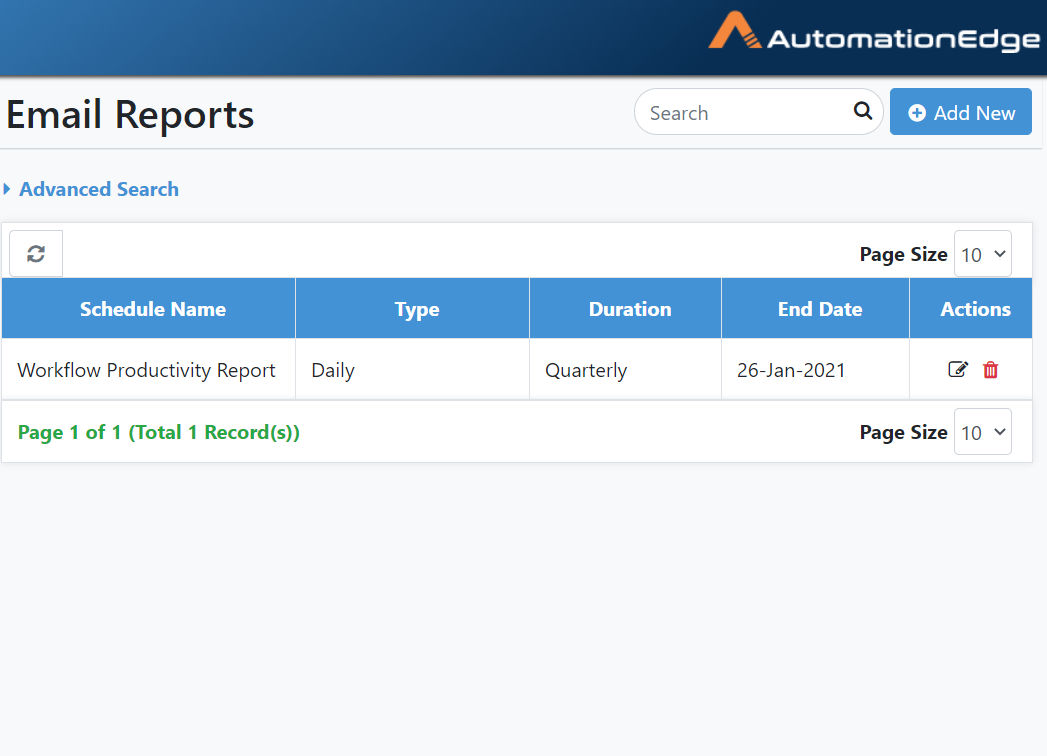
Figure 14.47: Email Reports Schedule Added
- The process of configuring the 'Email Reports Schedule' is complete. The report is sent in zip format to the email addresses configured.
Reports: Features/Permissions for other users
Table 14.3: Reports Features
| Feature/Role | Admin | Workflow Administrator | User Administrator | Agent Administrator | Tenant User | Activity Monitor |
|---|---|---|---|---|---|---|
| New Report | ✔ | ✔ | - | - | ✔ | ✔ |
| New Dashboard | ✔ | ✔ | - | - | ✔ | ✔ |
| Dashboard Selection | ✔ | ✔ | - | - | ✔ | ✔ |
| Reports Datasources and Template | ✔ | - | - | - | - | - |
| New Report (using Custom Report Template) | ✔ | ✔ | - | - | ✔ | ✔ |
| Email Report | - | ✔ | - | - | - | - |
*Tenant users can use the AutomationEdge features depending on Read, Write or Execute permissions granted to them on workflows.