Work with Dashboards
Use the feature to create multiple dashboards that act as containers for multiple reports. Keep all the reports to view together on one dashboard. At least one dashboard is required to start creating reports.
Create a new dashboard
In the section, you’ll learn how to create a new dashboard.
To create a new dashboard:
-
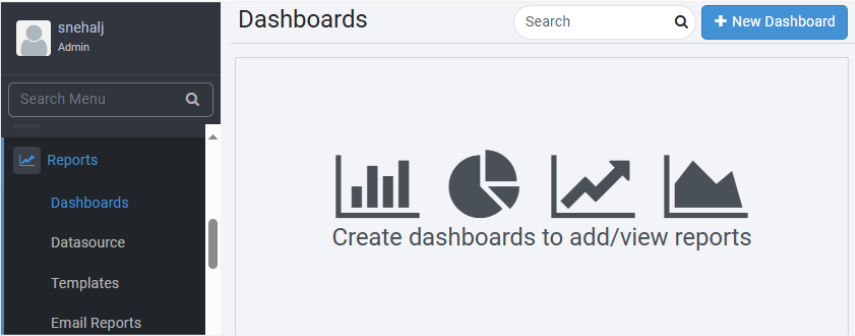
In the menu, click Reports → Dashboards. The Dashboards page appears.
-
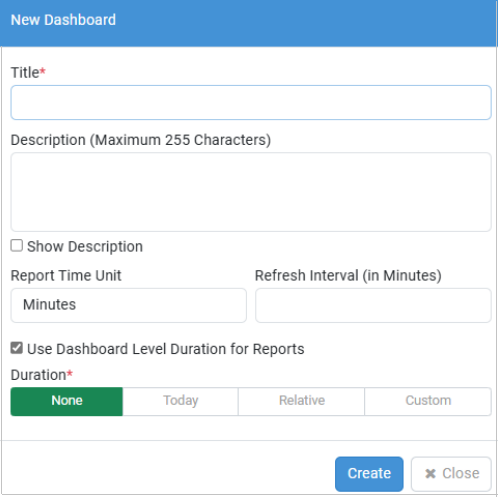
Click New Dashboard. The New Dashboard dialog appears.
-
Enter the following field details:
Field name Description Title* Enter a name for the dashboard. Description (Maximum 255 Characters) Enter a description of the dashboard. Show Dashboard Select the checkbox if you want to show the description of the dashboard on the dashboard page. Report Time Unit Select the report time unit in seconds, minutes, or hours. Refresh Interval (in Minutes) Enter the interval in minutes to refresh the dashboard view. You can set the refresh interval between 1-15 minutes.
Note: If you select the checkbox, you cannot specify a duration for individual reports.Duration Click any of the following tabs, as required for the dashboard:
- None: No duration details are required.
- Today: Enter the start and end hour in hours and minutes.
- Relative: Enter the duration in minutes, hours, days, months, or years, in either the Last or Next tab. If you select the Last tab, the generated report shows details of previous minutes, hours, days, months, or years.
If you select the Next tab, the generated report shows details of upcoming minutes, hours, days, months, or years.
- Custom: Select the date range for which you want to generate the report.*Indicates mandatory field.
-
Click Create. Dashboard created successfully message appears.
Notes:-
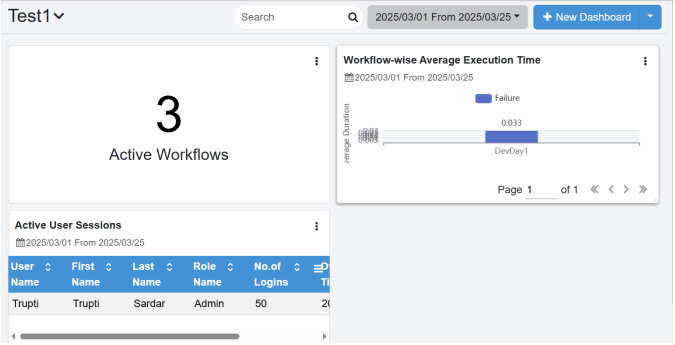
You can select another dashboard from the list adjacent to the dashboard name.

-
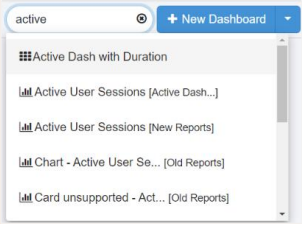
You can find dashboards and reports using the search option. Enter at least two characters of the name of the dashboard or report in the search box and click
 .
.
-
 : indicates a dashboard.
 -
 : indicates a report. In the list, the report name is followed by the name of the dashboard on which the report is available. For example, Active User Sessions [Active Dashboard].
If you searched for the dashboard then the dashboard appears with the reports, and if you searched for a particular report then the report appears on the dashboard and is highlighted in yellow briefly.
You can search for both types of reports, that is, Out-of-the-box and Custom reports.
-
-
-
Click Submit. The report is generated.
View dashbooard options
In the section, you'll learn about the various dashboard options.
To view dashboard options:
On the Dashboard page, click ![]() next to the New Dashboard. The dashboard action menu is available:
next to the New Dashboard. The dashboard action menu is available:
-
Edit Dashboard: Click to modify the selected dashboard settings.
-
Set As Default: Click to set the selected dashboard as the default dashboard.
Note:After you set the dashboard as the default dashboard, the Set As Default option is unavailable.
-
Pin to Home Page: Click to pin the dashboard to the Home page.
Notes:- The dashboard replaces the top four chart view on the Home page under the License Overview, Agent Threads, Assisted Agents, Step Units, and Process Studios section.
- After you pin the dashboard to the Home page, the Unpin from Home Page option is available.
-
Allow Public Access: Click to allow other tenant users of the specific tenant to view the dashboard.
Note:The dashboard name is suffixed with the term Public in the dashboard name list.

After you make the dashboard public, the Remove Public Access option is available.
-
Toggle Fullscreen Mode: Click to view the dashboard page in full screen mode.
-
Add Report: Click to add the report on the dashboard.
-
Delete Dashboard: Click to delete the dashboard.
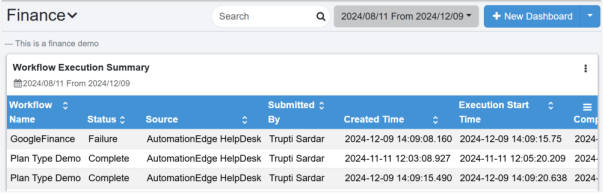
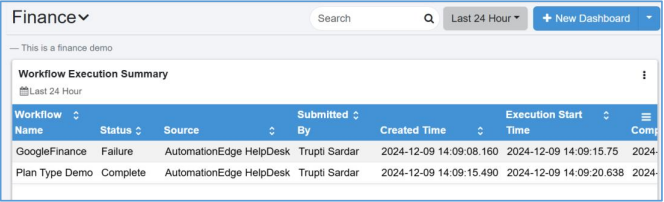
Apply dashboard filter
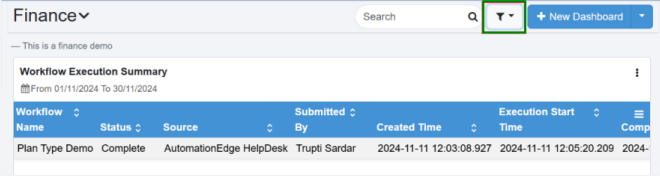
Fetch data for a specific duration on the dashboard by using the filter option. The Dashboard Filter allows users to apply live filter. The option is available only when a dashboard-level duration is selected.
Once a specific time-period is selected at the dashboard level, the filter icon becomes visible, allowing users to access and download the filtered data in PDF or CSV format.
If you apply filters on the dashboard, the filters will be applied to all reports displayed within the dashboard. Applying filters at the dashboard level ensures consistency and relevance of the data presented across all reports. This is a temporary filter, if you change the filter. You can reset the filter for the current session.
- The selected filters are temporary and cannot be saved to the dashboard.
- You can download the generated report.
Predefined Filters
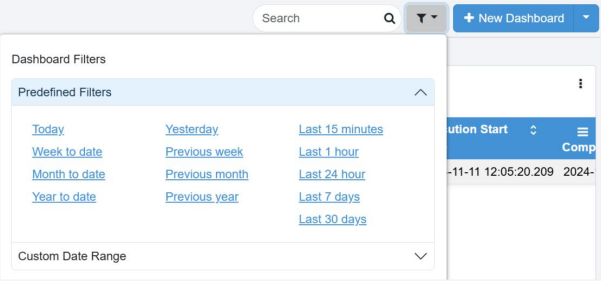
To apply a specific time frame to your dashboard, select a filter from the available options. For example:
- Today: Displays report for the current day.
- Yesterday: Displays report for the previous day.
- Last 15 Minutes: Displays report for the past 15 minutes and so on.
Custom date range
Apply custom date range to the dashboard, as required.
To apply a custom time to your dashboard:
-
Click Custom Date Range, the date range fields appear. Select the following field details:
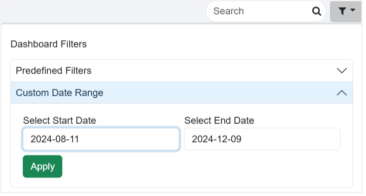
- Select Start Date: Select the date from which you want to fetch the data for the report.
- Select End Date: Select the date up to which you want include the data in the report.
-
Click Apply. The report for specified date is generated.