Understand AE Out-of-the-box (OOTB) reports
AutomationEdge comes with the following predefined report types; reports based on these can help you monitor your automation performance in several aspects. You can see the reports in tabular or card view or graph view.
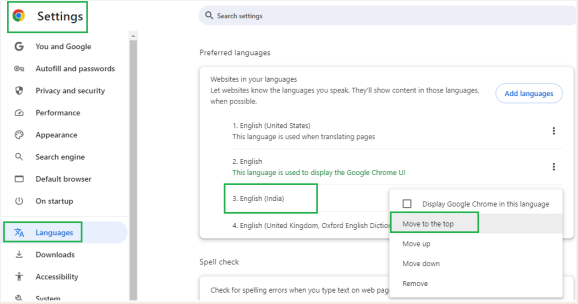
The localization of currency values for reports such as Total Profitability are based on the language selected in AutomationEdge, View Profile → User Profile dialog → Language. If the language is not selected in the AutomationEdge UI, then the browser’s localization settings are applied. See the following screenshot:
Radar charts are not supported in the current release, therefore, if you have charts from previous releases, then you must either delete the existing report or save the report to Table and then to Bar Chart view.
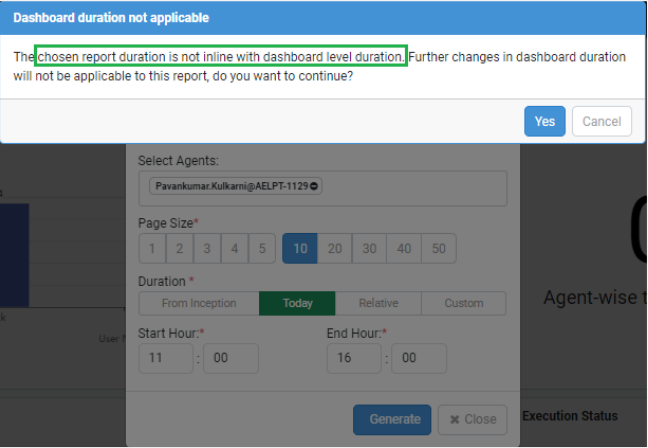
Duration settings You can apply different durations to the Dashboard and the reports on the Dashboard, if required. However, after you set the durations, changes made to the dashboard duration will not be applied to the report. For example, see the following screenshot:
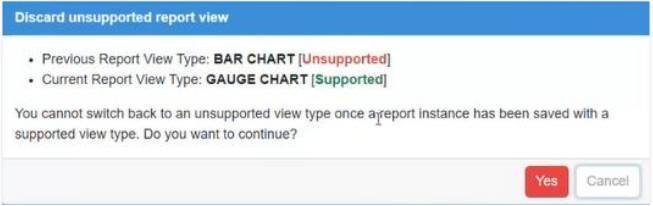
From release version 8.0.0, there are changes in the supported Chart report view type. When you migrate the reports from previous AE version to the current version, then the report will appear as you had generated previously. However, if you update the report view type, then you are asked for confirmation before proceeding with the update. See the following screenshot:
List of reports
Following is the list of available reports:
Applicable filters for selecting workflows or categories or agents appear along with the supported durations when you select a report type.
-
Active User Sessions: Shows the details of users who have logged in at least once during the duration selected for the report.
-
Active Workflows: Shows the count of all workflows that are enabled or active in AE.
-
Agent-wise Workflow Average Execution Time: Shows the average time of execution of requests by Agent.
-
Agent-wise Workflow Execution Status: Shows workflow execution status such as Execution Started, Complete, failure or unknown by Agent.
-
Agent-wise Workflow Request Report: It shows the number of completed and failed requests by the Agent.
-
Agent Utilization Report: Shows the report details of the agent availability and utilization in the selected duration. Recommendation: For best visibility of details, it’s recommended to select a maximum of five (5)agents when generating the report.
-
Average Daily Agent Utilization: Shows on an average how much time did the agent work per day in the given duration. Report time units will be decided based on dashboard setting.
Notes:- The report is duration sensitive, therefore, select either of the following duration tab and provide the details:
- Duration → Relative → Last → Days / Months / Years
- Custom → Date Range
- The average execution duration can be more than 24 hours as an agent can execute multiple threads in a session.
- The report is duration sensitive, therefore, select either of the following duration tab and provide the details:
-
Credential Expiry: It shows the list of credentials that are expiring in AE. Specify the start date and end date at the dashboard level.
-
Latest Workflow Execution Status: It shows the request status for the chosen period.
-
Active Workflows: It shows the count of all workflows that are enabled or active in AE.
-
Workflow-wise Profitability: It shows the profitability for each workflow. Only the Admin or a custom role having the permissions can view the report.
Note:Ensure you have defined the ROI for the workflows through Workflows → ROI Configuration.
-
Status-wise Workflow Operations Report: It shows the requests ordered by status.
-
Success Rate – Agent: It shows the total request count against the agent and the rate of success or failure of the agent’s request. Only the Admin can view the report.
-
Success Rate – Platform: It shows the total request count in AutomationEdge and the rate of success or failure of the total requests. Only the Admin can view the report.
-
Success Rate – Workflow: It shows the total request count for a workflow and the rate of success or failure of the total requests. Only the Admin can view the report.
Note:You can select single workflow or category only which is considered along with duration. Single selection of agent is allowed but not considered.
-
Time Saved Per Workflow: It shows the workflow wise time saved. Only the Admin or a custom role having the permissions can view the report.
Note:Ensure you have defined the ROI for the workflows through Workflows → ROI Configuration.
-
Time Saved – Consolidated: It shows the consolidated time saved after executing the workflows.
Note:Ensure you have defined the ROI for the workflows through Workflows → ROI Configuration.
-
Top Agents with Errors: It displays the list of agents with the most failed requests in a descending order. Only the Admin can view the report.
Note:Multiple selection of workflows or categories or agent is allowed, though none of these are considered.
-
Total Profitability: It displays the total profitability in card format. Only the Admin or a custom role having the permissions can view the report.
Note:Ensure you have defined the ROI for the workflows through Workflows → ROI Configuration → Workflows.
-
Total Request Count: It displays the count of requests under various status’, such as Complete, Failure, Diverted, Terminated, and Expired, in addition to the total count of requests.
-
Agent-wise total workflow execution time: Shows the total time for which the agent(s) was executing any workflow.
Note:The total execution duration can be more than 24 hours as an agent can execute multiple threads in a session.
-
Profitability Achievement Report: Shows how much of your target have you achieved in terms of your profitability goal from this platform.
- Ensure you have defined the ROI for the workflows through Workflows → ROI Configuration → Platform.
- The report is duration sensitive, therefore, select either of the following duration tab and provide the details: Duration → Relative → Last → Months / Years
- In the Gauge report view, in provide the minimum and maximum value. If you select Text Field Value user can enter the details, and if you select Database Column Value the existing target value appears.
- User-wise Average Execution Time: Shows average request execution time for the user.
- User-wise Execution Report: It shows the number of completed and failed requests by the user.
- User-wise Request Status Report: It shows the number of requests by the user for request status like New, Execution Started, Complete, Failure, or Unknown.
- User-wise Workflow Request Report: Shows report of User requests.
- Workflow-wise Average Execution Time: Shows average time execution of requests by Workflow.
- Workflow-wise Result Report: It shows the number of completed and failed requests by request.
- Workflow Average Idle Duration Report: Shows average idle time for a workflow after it is triggered. It will help understand the load on the system and adding/removing agents based on the information.
- Workflow Execution Summary: It is a report of all execution details of the workflows.
- Workflow Failure Report: Shows failed workflow requests.
- Workflow Productivity Report: It compares manual turnaround time (TAT) with RPA TAT for the workflows. It readily shows the percentage improvement with RPA.
Note:
If the Workflow Productivity Report must be created than from ROI Configuration only workflow wise measurement metric can be used for manually required time field for the release.
- Workflows in execution: Shows the count of workflows that are currently in execution state.
- Running Requests Status - PostgreSQL and Oracle: Shows running requests and their elapsed execution time. Works only for PostgreSQL or Oracle application DB.
- Running Requests Status – MSSQL: Shows running requests and their elapsed execution time. Works only for MSSQL application DB.
Example: Workflow Productivity Report
It compares manual turnaround time (TAT) with RPA TAT for the workflows. It readily shows the percentage improvement with RPA. Following is a screenshot of the Workflow Productivity Report.
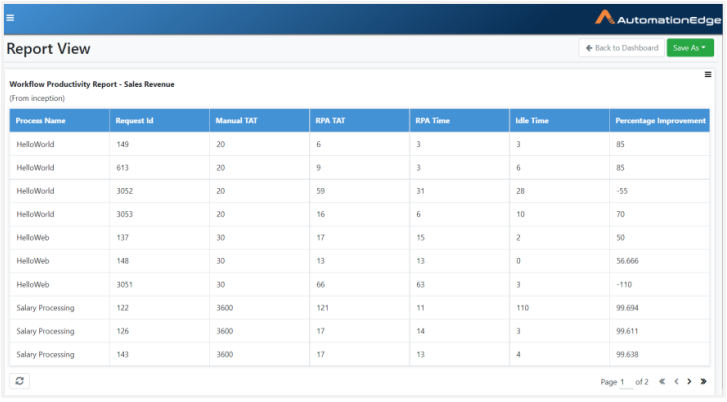
The following table describes the report columns:
| Field name | Description |
|---|---|
| Process | Displays the name of the AutomationEdge workflow. |
| Request Id | Displays the workflow execution Request Id. |
| Manual TAT | Displays manual execution time (in seconds) specified while configuring a workflow. |
| RPA TAT | Displays the total time taken by a workflow to complete execution (RPA Time + Idle Time); is the same time seen on the Requests tab. |
| RPA Time | Displays the actual time (in Seconds) taken for the request to complete once the Agent has picked it up. |
| Idle Time | Displays the timespan (in Seconds) between submitting a request and the Agent picking it up for execution. |
| Percentage Improvement | It is the improvement in terms of TAT as compared to manual execution. |
*TAT => Turn Around Time