Work with Datasource for Custom reports
The need for custom reports typically arises when there is a need to assimilate AutomationEdge data and customer’s business data. We recommend maintaining a separate schema for custom reports. The users need to create and manage the schema containing the customer’s business data and AutomationEdge data preferably exposed as views.
The chapter includes the following:
Create new datasource
AutomationEdge provides the Datasources feature to create and manage custom reports. Datasource is the schema to fetch the report data.
You can create new datasource, as required.
To create a new datasource:
-
In the menu, click Reports → Datasource. The Datasource page appears.
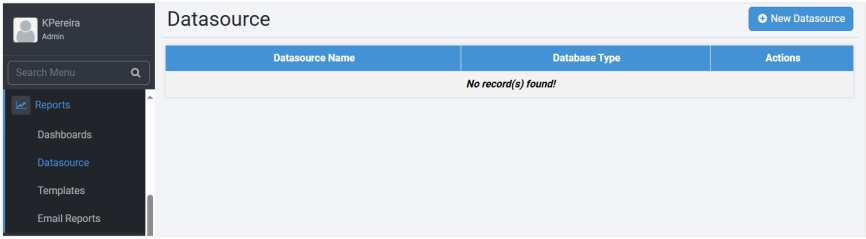
-
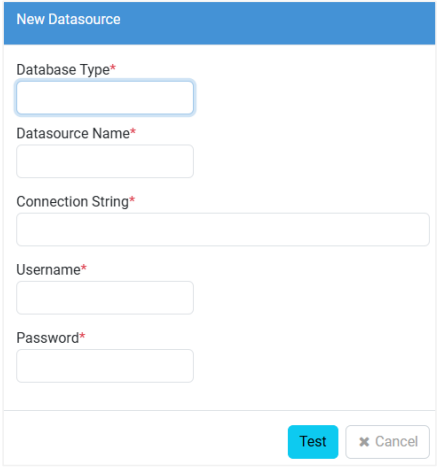
Click New Datasource. The New Datasource dialog appears.
-
Enter the following field details:
Field name Description Database Type * Select the type of database you want to create. The available options are:
- PostgreSQL
- MS-SQL
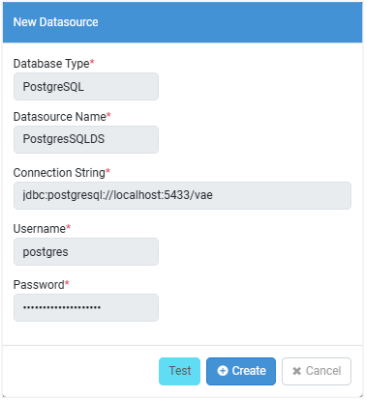
- OracleDatasource Name * Enter a name for the datasource. Connection String * Enter a JDBC connection string to the database. For example, jdbc:postgresql://localhost:5433/vae, assuming you have the database on the same machine as the AutomationEdge server, else replace with the IP address. Username * Enter the name of the user with which you’ll connect with the datasource. Password * Enter the password to connect with the datasource. *Indicates mandatory field.
-
Click Test. The database connection is validated and the option to Create database appears.
-
Click Create. The datasource is created.
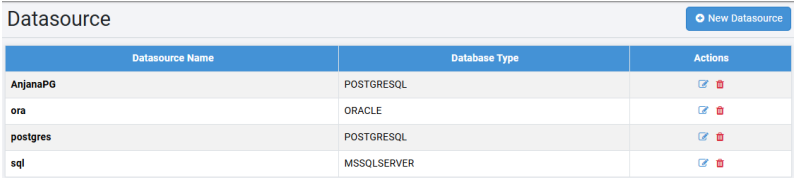
- To modify the datasource details, click
 and after making the required changes, click Update.
 - To delete the datasource, click
 .
.
Create custom reports using templates
Use the Template feature to create and manage custom reports. Templates define the layout of the report and includes the data fetched through the datasource and the report format.
Template creation permission to create tenant-specific and workflow specific templates is available to Admins and Workflow Administrators, respectively. Tenant users can use these templates for creating reports.
Define Templates by specifying a database query, the desired attributes, and the desired format for generating reports. There are three types of templates that you can use to create a custom report. The template types are:
- Classic template
- Flat Query template
- Structured Query template
Create Classic template using JSON based approach
In the section, you’ll learn how to create classic template using JSON based approach.
To create a new classic template using JSON Based approach:
-
In the menu, click Reports → Template. The Templates page appears.
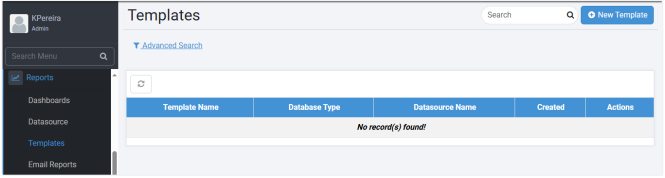
-
Click New Template. The New Template page appears.
-
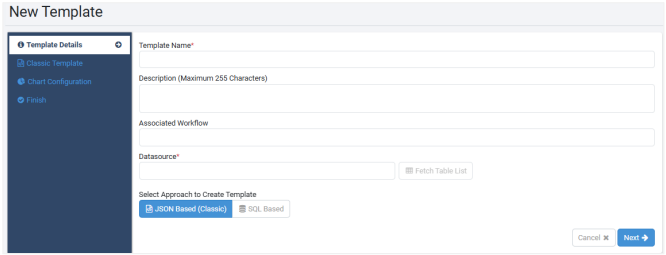
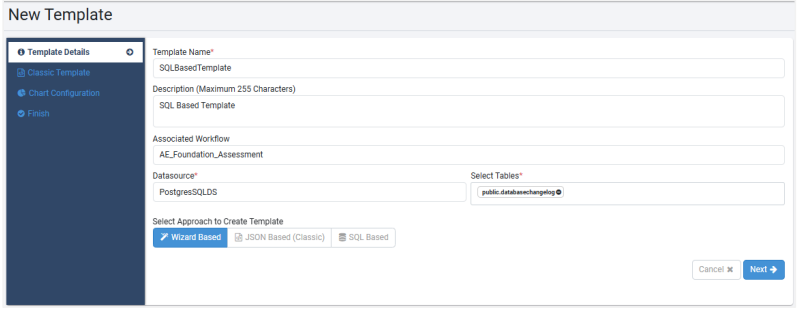
Enter the following field details:
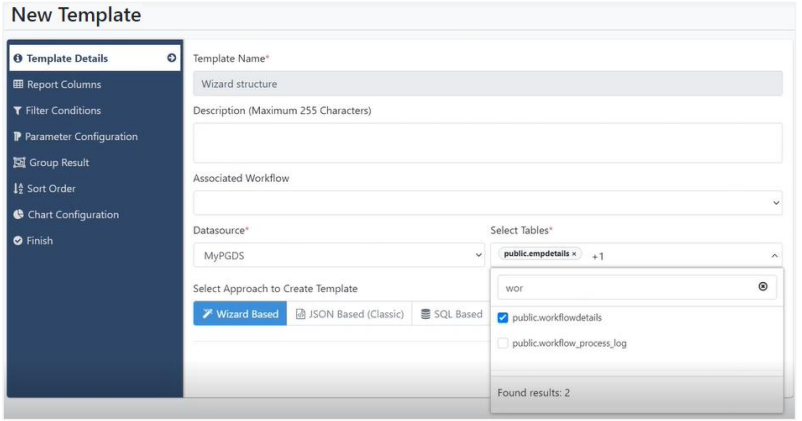
Field name Description Template Name * Enter the name of the template you want to create. Description (Maximum 255 Characters) Enter a description of the template. Associated workflow Select an associated workflow. If selected, only users with permission to the workflow will have access to the template, and the report will be specifically for data of that workflow. Datasource * Select the datasource from the list.
Note: To get a list of tables, click Fetch Table Lists, which is available only after you select the data source. However, use the table details only for creating the Structured Query Template.*Indicates mandatory fields.
-
After filling the details, click JSON Based (Classic) under Select Approach to Create Template. In the Classic Template page, the report placeholder template query is generated.
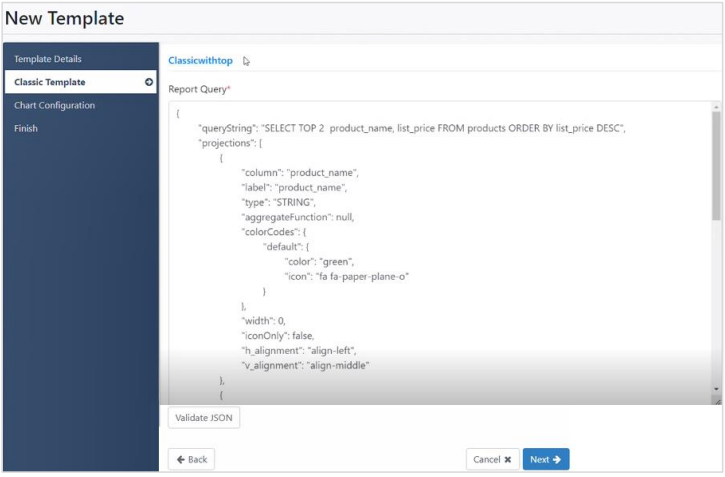 Note:
Note:As the generated template query is a placeholder and not a working JSON query, you must modify the query to achieve the required result.
-
Click Validate JSON. The validation is successful message appears.
-
Click Download as CSV. The generated report is downloaded in CSV format.
-
Click Next. The Chart Configuration page appears.
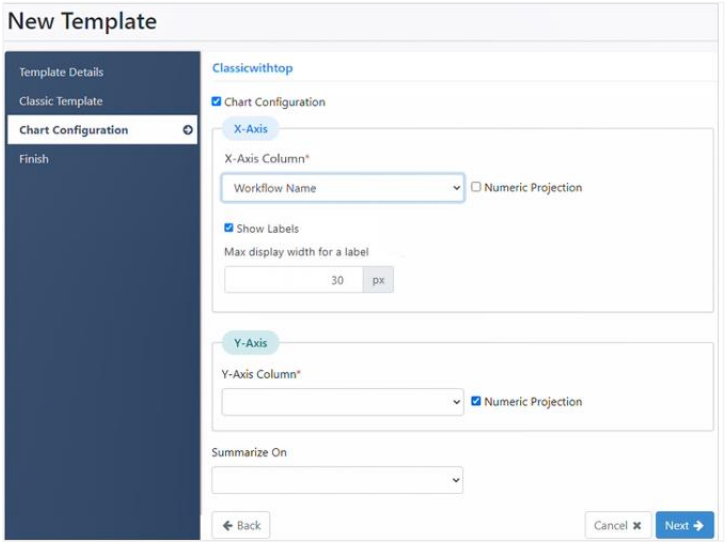
i. Enter the following field details:
Field Name Description Chart Configuration Select the checkbox to select the axis details. X-Axis Column* Select the field that will be the X-axis.
Note: Select the Numeric Projection checkbox if the column value data type is numeric.Show Labels Select the checkbox to display the labels as available in the projections. Maximum Display width for a label Set the character display limit for the label in pixels. For example, if the pixel is 30, then characters after 30 pixels will be truncated in the view. Y-Axis Column* Select the field that will be the Y-axis.
Note: Select the Numeric Projection checkbox if the column value data type is numeric.Summarize On Select the field based on which the chart details will be summarized. *Indicates mandatory field.
ii. After selecting the chart configuration details, click Next. The Finish page appears.
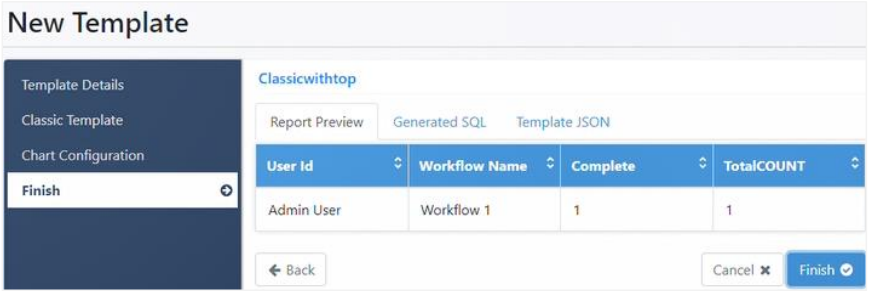
iii. On the Finish page, click each of the following tabs:
- Report Preview: Displays the preview of the report based on the columns called in the SQL query.
- Generate SQL: Displays the generated SQL query for a template.
- Template JSON: Displays the complete report template JSON preview.
-
Click Finish. The template appears in the Template page.
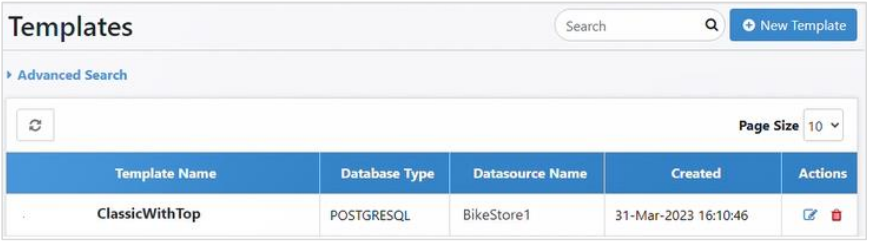
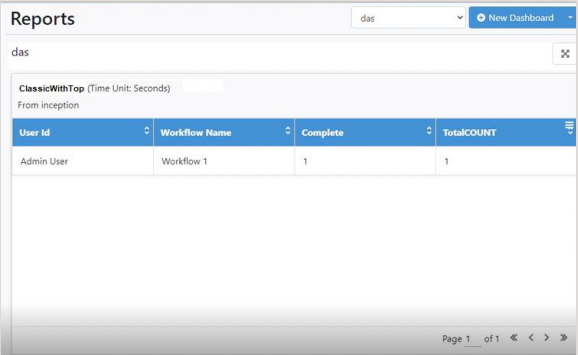
The template appears in the Dashboard, which you can use to generate reports.
Create Flat Query template using SQL based approach
In the section, you’ll learn how to create a flat query template using SQL based approach.
To create a flat query template using SQL Based approach:
-
In the menu, click Reports → Template. The Templates page appears.
-
Click New Template. The New Template page appears.
-
In the Template Details section, enter the field details. The following options are available under Select Approach to Create Template after you select the tables in the Select Tables list:
- Wizard Based
- JSON Based (Classic)
- SQL Based
 Note:
Note:For field details, see Create Classic template using JSON based approach.
-
Click SQL Based and then click Next. The SQL Query menu appears in the left pane.
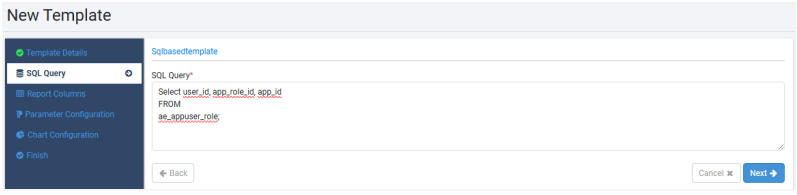
In SQL Query, enter the query, which is tested, and then click Next. The Report Columns page appears.
-
In the Report Columns section, the columns selected in SQL Query appear.
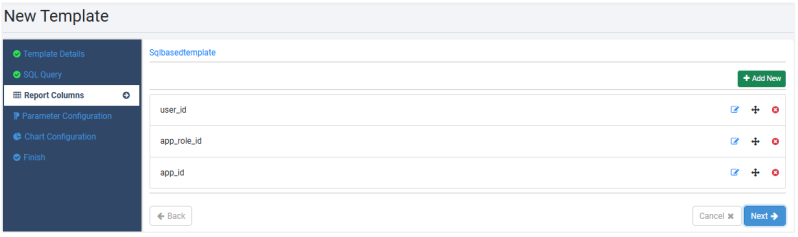
If the SQL Query’s select statement contains ‘*’, that is, all columns, then you need to add the projection columns manually using Add New in the Report Columns page.
To add a new column: i. Click Add New. The Add Column dialog appears.
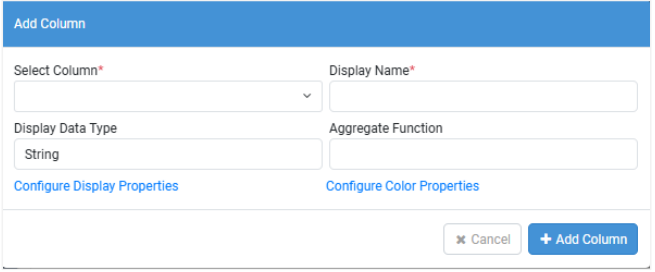
ii. Enter the following field details:
- Select Column: Select the name of the column, as called out in the SQL query.
- Display Name: Enter the column name, as you want it to appear in the report.
- Display Data Type: Select the data type of the selected column.
- Aggregate Function: Select the aggregate function used for the selected column. For example, COUNT, AVERAGE, and so on.
iii. Click Configure Display Properties, to set the horizontal and vertical text alignment and the width of the columns, as you want to appear in the report.
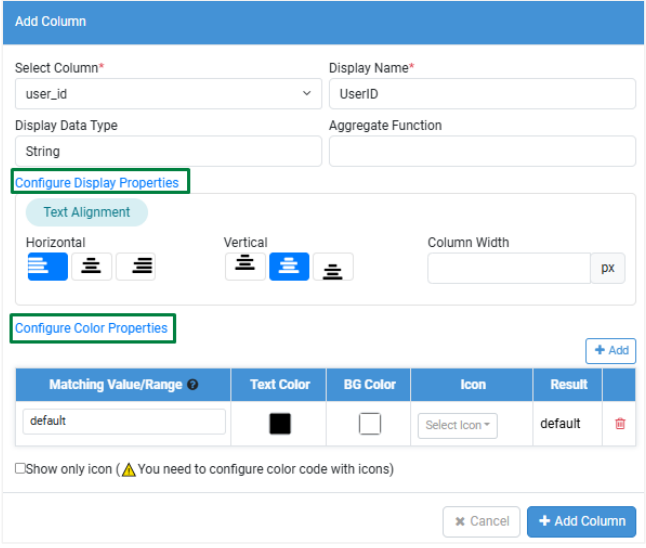
iv. Click Configure Color Properties, to set the colors for values of columns, as required.
- Click Add. A new row appears.
- Enter the following details:
o Matching Value/Range: Enter the name of the value or range that when matched will change the color of the text in the report.
o Text Color: Select the text color of your choice. - BG Color: Select the background color, if required.
o Icon: Select the icon that you want to assign with the text.
o Result: Displays the text and the icon associated with the text.
v. Click Add Column. The column appears in the Report Columns page.
vi. In the Reports Column page, in addition to adding new columns, if required, you can perform any of the following tasks:-
To view the actual JSON details for a projection column, click on the column name and expand the view.
-
To modify the details of the columns, click
make the required changes and then click Update Column.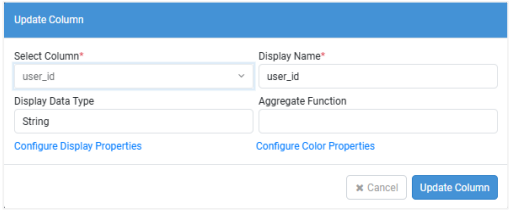
-
To sort the columns, click Move (
 ), and then drag-and-drop the column to the location of your choice.
 -
To delete the column, click Remove.
vii. Click Next. The Parameter Configuration page appears.
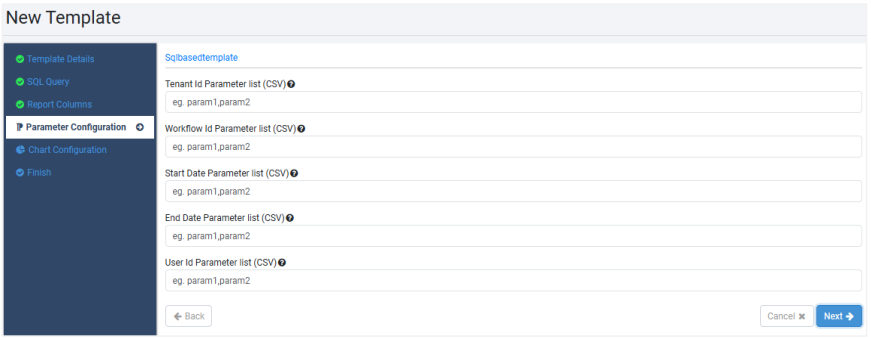
Field name Description Tenant Id Parameter list (CSV) Enter the name of the tenant ID parameter list.
Note: For both SQL Based and Wizard based approach, it specifies a list of parameter names for tenant IDs. For example,["param1", "param2"].
AE Engine identifies these parameters in the query. The parameters should be present in the query as :param1 and :param2.
It substitutes these query parameters by run time values of the tenant id of the user running the report. This parameter value in the query table should be numeric.Workflow Id Parameter list (CSV) Enter the name of the workflow ID parameter list.
Note: Only for the SQL Based approach, it specifies a list of parameter names for workflow IDs. The AE engine identifies these parameters in the query and substitutes them with runtime values. This parameter value in the query table should be numeric.Start Date Parameter list (CSV) Enter the name of the start date parameter list.
Note: Only for the SQL Based approach, it specifies a list of parameter names for the start date. The AE engine identifies these parameters in the query and substitutes them with the start date-time stamp of the report. This parameter value in the query table should be of type date.End Date Parameter list (CSV) Enter the name of the end date parameter list.
Note: Only for the SQL Based approach, it specifies a list of parameter names for the end date. The AE engine identifies these parameters in the query and substitutes them with the end date-time stamp of the report. The parameter value in the query table should be of type date.User Id Parameter list (CSV) Enter the name of the user Id parameter list.
Note: For both, SQL Based and Wizard based approach, it specifies a list of parameter names for user IDs. For example, [“param1”, “param2”].
AE engine identifies these parameters in the query. These parameters should be present in the query as :param1 and :param2. It substitutes the query parameters by the run time values of the user ID running the report.
If Tenant users execute a custom report with theuserIdParamNamesoption, the user can see rows that contain the user ID.
If Tenant users execute a custom report with theuserIdParamNamesoption, they can see rows that contain their user ID.
However, if Admins execute a custom report with theuserIdParamNamesoption, the user can see all rows for the first, that is, oldest created 1000 users.
The parameter value in the query table should be numeric. -
Click Next. The Chart Configuration page appears.
Note:For Chart Configuration field details, see Create Classic template using JSON based approach.
-
Click Next. The Finish page appears.
Note:For details about the three tabs, see Create Classic template using JSON based approach.
-
Click Finish. The template appears in the Template page.
Note:The template appears in the Dashboard, which you can use to generate reports.
Create Wizard Based Structured Query template
In the section, you’ll learn how to create wizard based structured query template.
To create wizard based structured query template:
-
In the menu, click Reports → Template. The Templates page appears.
-
Click New Template. The New Template page appears.
-
In the Template Details section, enter the field details. The following options are available under Select Approach to Create Template after you select the tables in the Select Tables list:
- Wizard Based
- JSON Based (Classic)
- SQL Based
-
Click Wizard Based and then click Next. The Wizard Based menu appears in the left pane.
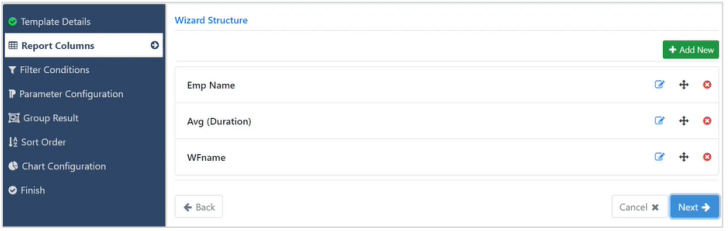
-
In the Report Columns page, you can perform the following tasks, if required:
- Click Add New, to add new columns.
- Click Edit, to modify the column details.
- Click Move, to sort the columns on the page.
- Click Remove, to delete the column.
Note:For details about field details and tasks, see Create Flat Query template using SQL based approach.
-
Click Next. The Filter Conditions page appears.
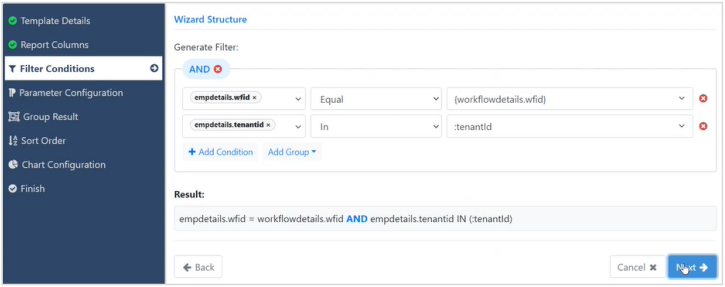
▪ In the Filter Conditions page:
o Click Add Group. From the list, select the grouping option, AND or OR.
o Click Add Condition, and select the filter condition, the comparator, and the mapped column. The filter conditions are captured in the Result field. -
Click Next. The Parameter Configuration page appears.
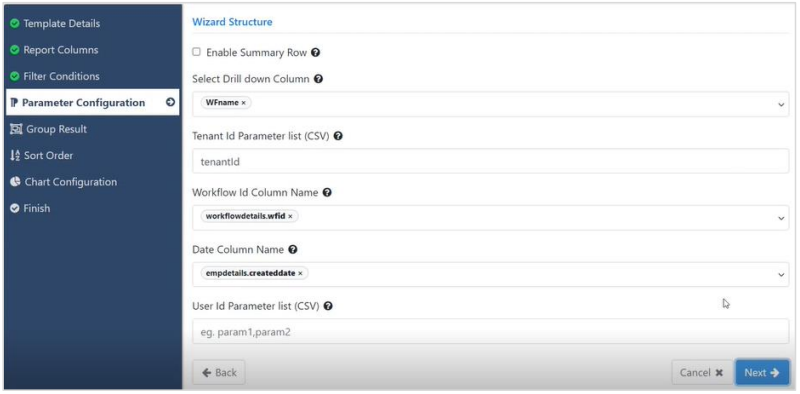
Enter the following details:
Field name Description Enable Summary Row Select the checkbox if you want the summary row in the report.
Note: Only for structured query, a boolean value specifying if the summary row should be present for the report or not.Select Drill down Column Select the column on which you want to drill down.
Note: Only for structured query, if the report needs a feature where clicking on a row drills down further, the user must populate this field with the column's name to use for further grouping. This name must be present in projections.Tenant Id Parameter list (CSV) Enter the name of the tenant ID parameter list.
Note: For both SQL Based and Wizard based approaches, it specifies a list of parameter names for tenant IDs, for example,["param1", "param2"].
The AE engine identifies these parameters in the query. These parameters should be present in the query as :param1 and :param2.
It substitutes these query parameters by run time values of the tenant ID of the user running the report. The parameter value in the query table should be numeric.Workflow Id Column Name Select the workflow ID column name.
Note: For structured query only, this parameter can be present only ifworkflowIdParamNamesis not present. The parameter has the workflow ID column on which the engine adds a workflow ID filter.Date Column Name Select the date column name.
Note: Only for structured query, this parameter can be present only ifstartDateParameterNamesandendDateParamNamesare not present. The parameter has the name of the column on which the engine adds the date filter. The parameter value in the query table should be of type date.User Id Parameter list (CSV) Enter the name of the user Id parameter list.
Note: For both, SQL Based and Wizard based approach, it specifies a list of parameter names for user IDs. For example, [“param1”, “param2”].
The AE engine identifies these parameters in the query. The parameters should be present in the query as :param1 and :param2. It substitutes these query parameters by the run time values of the user id running the report.
If Tenant users execute a custom report with the userIdParamNames option, the user can see rows that contain his user id.
However, if Admins execute a custom report with the userIdParamNames option, the user can see all rows for the first, that is, oldest created 1000 users.
This parameter value in the query table should be numeric. -
Click Next. The Group Result page appears.
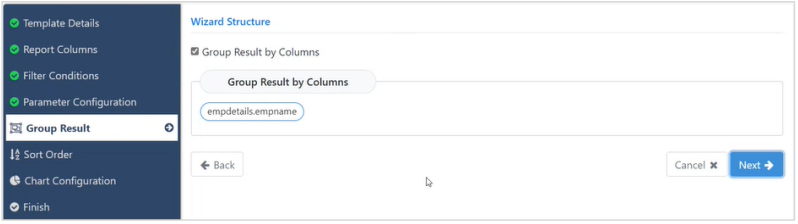
-
Select the Group Result by Columns checkbox. The group by columns appear in Group Result By Columns.
Note:Group by columns are selected based on report columns (projections) and aggregate functions used on the columns. Number of group by columns also depend on configured parameters. If the inner Query column name is configured, then group must have only one column, therefore, the user needs to remove some of the group by columns.
To remove some of the group by columns, hover over the column, and then click Remove column that appears.
-
Click Next. The Sort Order page appears.
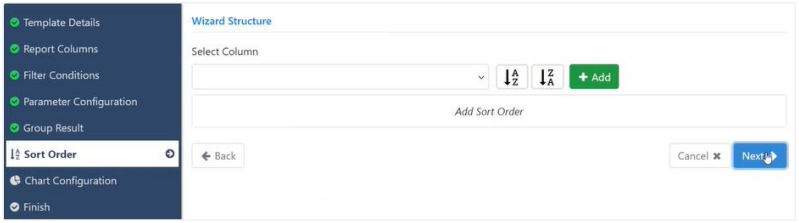
-
Select a column by which you want to sort the data, and then click either, A-Z or Z-A for ascending or descending sorting order, respectively.
-
Click Add to add the selected column to the sort order list.
-
Click Next. The Chart Configuration page appears.
Note:For Chart Configuration field details, see Create Classic template using JSON based approach.
-
Click Next. The Finish page appears.
Note:For details about the three tabs, see Create Classic template using JSON based approach.
-
Click Finish. The template appears in the Template page.
Note:The template appears in the Dashboard, which you can use to generate reports.