Work with Reports
In the chapter, you’ll learn about the various reports you can view and how to generate the reports that inform you about the features and plugins that a tenant is using. In addition, you can generate reports to understand the system status.
The chapter consists of the following topics:
- Usage Analytics reports
- Agent Utilization report
- Consumption report
- System Status reports
Usage Analytics reports
You can generate report that help in understanding the AE platform, step, workflow, and feature usage.
Multiple users cannot submit a report generation request if report generation is already in-progress. The users will receive an error message if they try to submit the request.
To generate report:
-
In the menu, go to Reports -> Usage Analytics.The Usage Analytics page appears.
-
Enter the following field details:
Field name Description Generate For* Select the report that you want to generate. You can generate the following types of reports:
• Calendar Year
• Active License Year
• Year RangeYear* Select the year for which you want to generate the report.
Note: The field is available only if you select the Calendar Year report.Tenant Select the tenants for which you want to generate the report. From Year* Select the year from which you want to generate the report.
Note: The field is available only if you select the Year Range report.To Year* Select the year to which you want to generate the report.
Note: The field is available only if you select the Year Range report.* Indicates mandatory field.
-
Click Submit. The report is generated.
You can generate the reports for one or all tenants, as required and download the reports. For details, see the following screenshot:
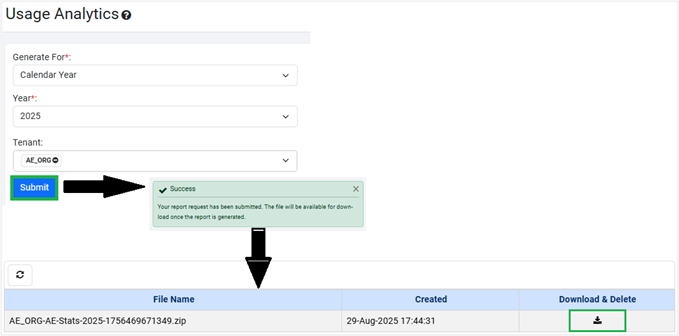
Figure 85: Usage Analytics page
Click ![]() to refresh the view.
to refresh the view.
The report is automatically deleted from the Usage Analytics page after you download the report.
The downloaded zipped folder content appears as follows:
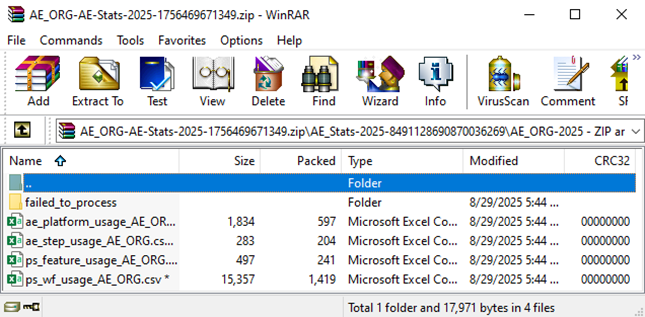
Figure 86: Zipped folder view
Agent Utilization report
As the number of hosted agents increases, the performance and utilization of the agents is impacted.
As a System Admin, monitoring the performance and utilization of agents is required to ensure operation efficiency and address any potential issues. Monitoring agent utilization also allows you to provide recommendations for virtual machine resource allocation.
Use the Agent Utilization report to view the detailed machine resource usage metrics. You can filter data by tenant and date range to view details.
To generate agent report:
-
In the menu, click Reports -> Agent Utilization. The Agent Utilization page appears.
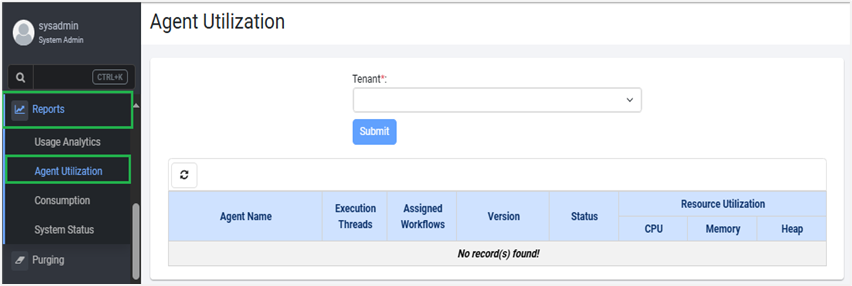
Figure 87: Reports -> Agent Utilization -> Agent Utilization page
-
In the Tenant list, select the tenant org code for which you want to generate the report, and then click Submit. The utilization report appears with three tabs:, Agents, Assisted Agents, and Agent Controllers.
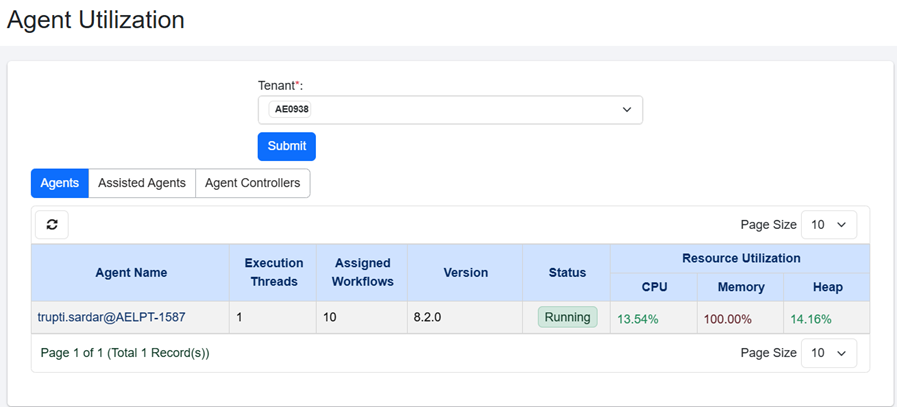
Figure 88: Agent Utilization -> Agents tab view
For Cloud users only, the option to manually initiate the Agent upgrades, (Actions column and /or Upgrade Agents <number of agents to upgrade> (![]() )), will be available if the following property is set in the ae.properties file:
)), will be available if the following property is set in the ae.properties file:
ae.feature.manage-agent-upgrades.enabled=true
A notification about the available agent version appears on the Agent Utilization page

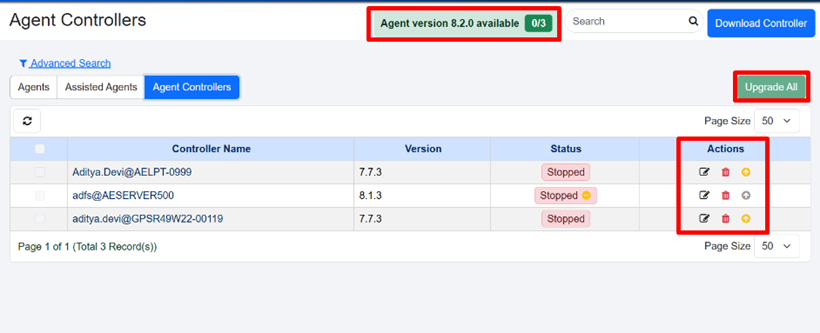
To upgrade the agent to the latest version:
- In the Actions column click
 .
.
OR
- Select the checkbox next to the agent you want to upgrade, and then click Upgrade Agents
<number of agents to upgrade>( )
)
The option to upgrade the agent is available if the Agent status is RUNNING, or STOPPED, or STOPPED (Out of memory) or UNKNOWN.
- In the Agents tab, view the following column details:
| Field name | Description |
|---|---|
| Agent Name | Displays the name of the hosted agent. |
| Execution Threads | Displays the number of work threads being executed by the agent. |
| Assigned Workflows | Displays the number of workflows assigned to the agent. |
| Version | Displays the agent version. |
| Status | Displays the agent status. |
| Resource Utilization – CPU | Displays CPU usage in percentage. |
| Resource Utilization – Memory | Displays memory usage in percentage. |
| Resource Utilization – Heap | Displays heap usage (disk space and JVM parameter) in percentage. |
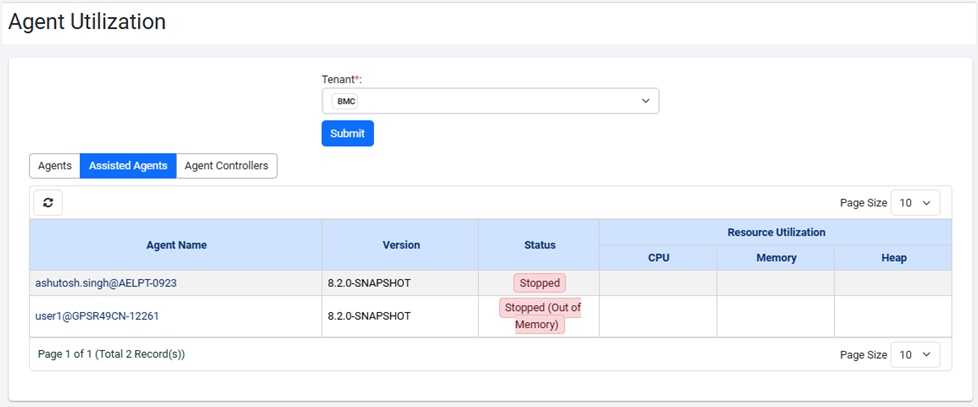
Figure 89: Agent Utilization -> Assisted Agents tab view
-
In the Assisted Agents tab, view the following field details:
Field name Description Agent Name Displays the name of the hosted agent. Version Displays the Agent version. Status Displays the agent status. Resource Utilization – CPU Displays CPU usage in percentage. Resource Utilization – Memory Displays memory usage in percentage. Resource Utilization – Heap Displays heap usage (disk space and JVM parameter) in percentage. 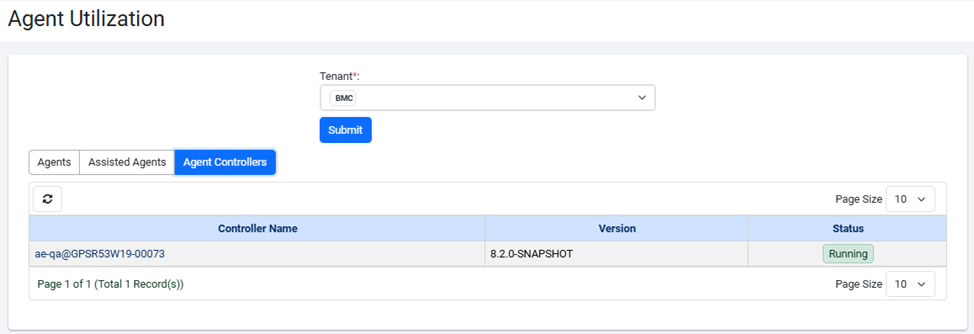
Figure 90: Agent Utilization -> Agent Controllers tab view -
View the following field details for Agent Controllers tab:
Field name Description Controller Name Displays the name of the controller agent. Version Displays the Agent version. Status Displays the agent status.
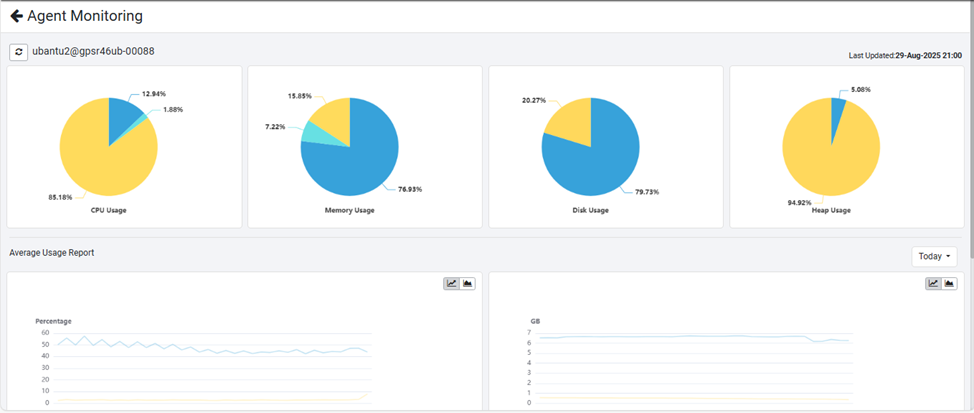
View graphical representation of Agent Utilization report
In addition, you can view the graphical representation of the agent utilization details.
To view the graphical representation of the agent utilization:
- In the Agent Name column, click the agent’s name link. The Agent Monitoring page appears.
- Click
 . The Dashboard Filters options appear.
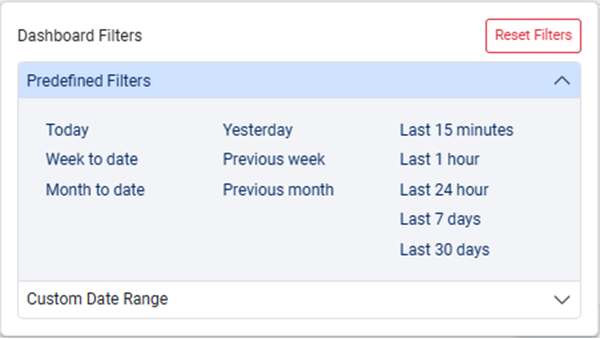
Figure 92: Dashboard Filters
-
Select the predefined filters to display data in the Average Usage Report section for ranges such as Today, Week to Date, Month to Date, and so on.
OR
Set the date range for which you want to display the data and click Apply. The data is displayed for the selected date range in the Average Usage Report section.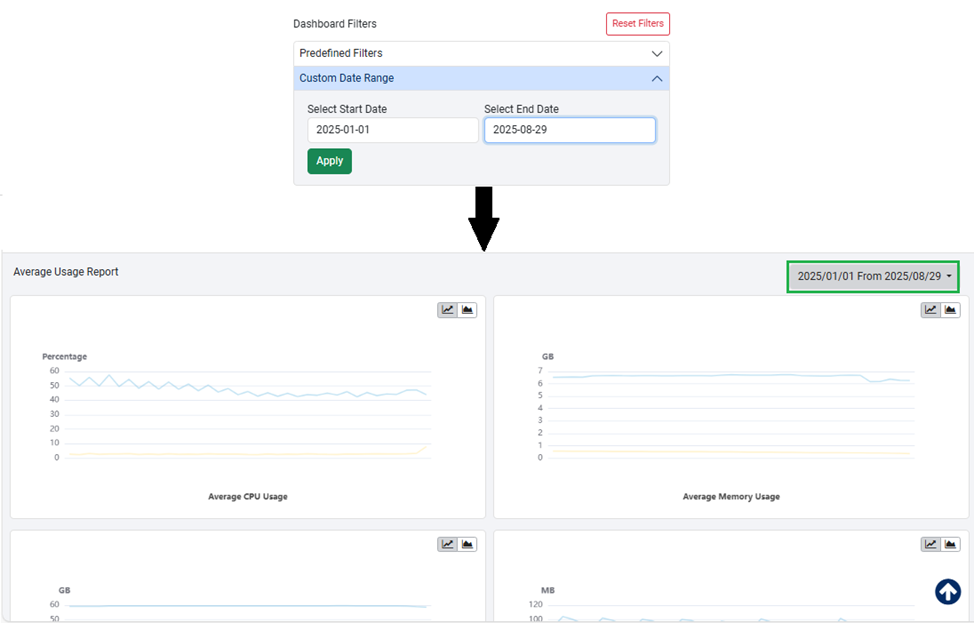
Figure 93: Custom Date Range
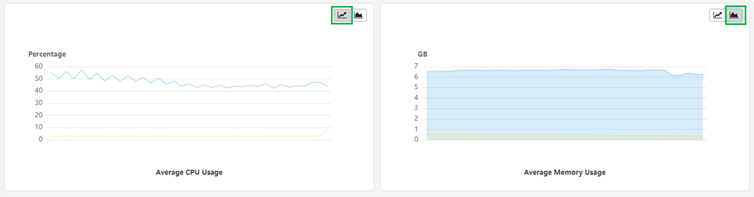
Click ![]() or
or ![]() to change the graph view.
to change the graph view.
To remove the selected filters, click Reset Filters. The filter ( ) icon appears.
Consumption report
You can generate the DocEdge-Pages Consumption Summary Report that provides details such as count of pages and documents consumed (extracted or rejected or repaired) in the selected period.
If you want to also view consumption-tenant (CBM) reports in the list, then in the ae.properties file set the flag to true for the ae.feature.consumption-based-licensing.enabled property.
ae.feature.consumption-based-licensing.enabled =true
To generate the report:
-
In the menu, click Reports -> Consumption. The Consumption reports page appears.
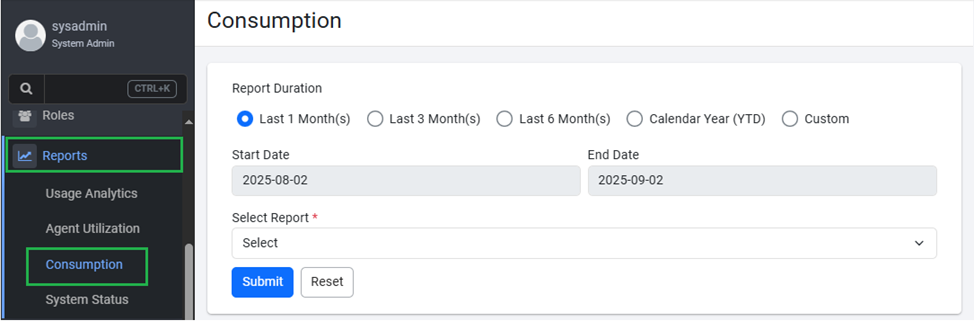
Figure 93: Consumption Report view -
In the Report Duration section, select the duration for which you want to generate the report.
- Last 1 Month(s): Select the option if you want to generate the report for the last one month.
- Last 3 Month(s): Select the option if you want to generate the report for the last three months.
- Last 6 Month(s): Select the option if you want to generate the report for the last six months.
- Calendar Year (YTD): Select the option if you want to generate the report for the calendar year, which would include the current date and year.
- Custom: Select the option if you want to generate the report for a period of days, weeks, months, or years.
-
In the Select Report list, choose the report you want to generate. Currently only DocEdge-Pages Consumption Summary Report is available.
-
Click Submit. The report is generated, which you can download as a
.csvfile.
To clear the details entered to generate the report, click Reset.
To view report details:
The following field details are displayed when the report is generated:
- Tenant Name: Displays the names of tenants for whom the report is generated.
- Advanced-Page Count: Displays the total number of page count consumed by the DocEdge: GenAI and DocEdge: Azure OCR plugin steps.
- Advanced-Doc Count: Displays the total number of documents processed by the DocEdge: GenAI and DocEdge: Azure OCR plugin steps.
- Extraction-Page Count: Displays the total number of page count consumed by the DocEdge: Get Value, DocEdge: Get Table, and DocEdge: Azure OCR plugin steps.
- Extraction-Document Count: Displays the total number of documents processed by the DocEdge: Get Value, DocEdge: Get Table, and DocEdge: Azure OCR plugin steps.
- Classification-Page Count: Displays the total number of page count consumed by the DocEdge: Classify Documents plugin step.
- Classification-Doc Count: Displays the total number of documents processed by the DocEdge: Classify Documents plugin step.
System Status report
You can generate system status reports that provide details, such as license status, number of workflows, number of registered agents, and so on.
To generate a report:
-
In the menu, click Reports -> System Status. The System Status page appears.
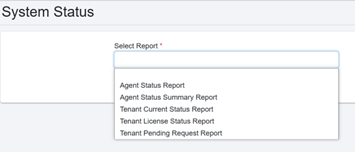
Figure: System Status Page -
In the Select Report list, choose the report you want to generate. The available reports are:
- Agent Status Report: Generate report to view the status of the tenant’s agent.
- Agent Status Summary Report: Generate a report to view the agent status and the number of times it was in each state: Running, Stopping, Stopped, Unknown, Pending Update, Updating, Upgrading, and Restarting.
- Tenant Current Status Report: Generate report to view details of the tenant’s active license status.
- Tenant License Status Report: Generate report to view details of tenant’s license status. You can add additional columns to the report.
- Tenant Pending Request Report: Generate report to view number of pending sequential and regular and singleton requests.
-
Click Submit. The report is generated, and you can view the details on the System Status page.
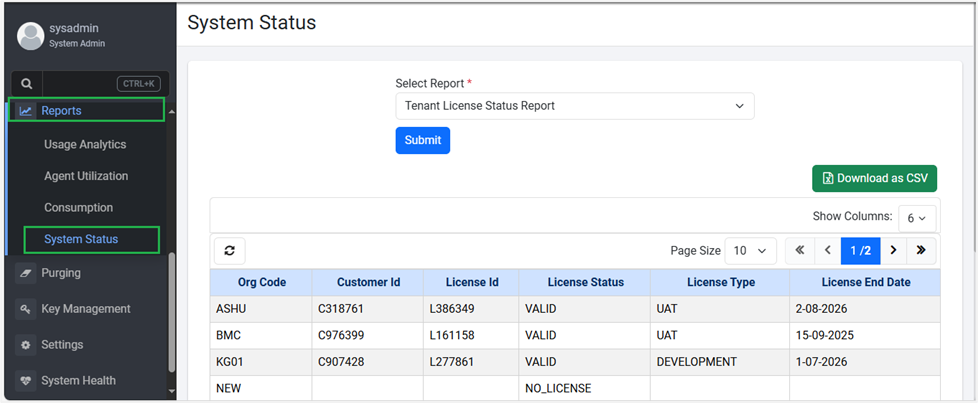
Figure 94: System Status page -
Click Download as CSV. The generated report is downloaded in CSV format.