Work with Dashboards
Dashboards help you monitor your automation performance by bringing multiple reports together in one place. Instead of gathering data from different sources, you get a consolidated, real-time view that updates automatically at intervals you choose. The Dashboards page lists all available reports and displays key details such as the report name, description, duration, and other relevant information. You can apply date filters across all reports on a dashboard at once, download reports as PDF or CSV, and pin important dashboards to your Home page for quick access. If you need to share insights with your team, you can make a dashboard public or export it as a JSON file for use on another instance. Admins, Workflow Admins, Activity Monitors, and Tenant Users can all create and view dashboards based on their role permissions. At least one dashboard is required to start creating reports.
Create a new dashboard
In the section, you’ll learn how to create a new dashboard.
To create a new dashboard:
-
In the menu, click Reports → Dashboards. The Dashboards page appears.
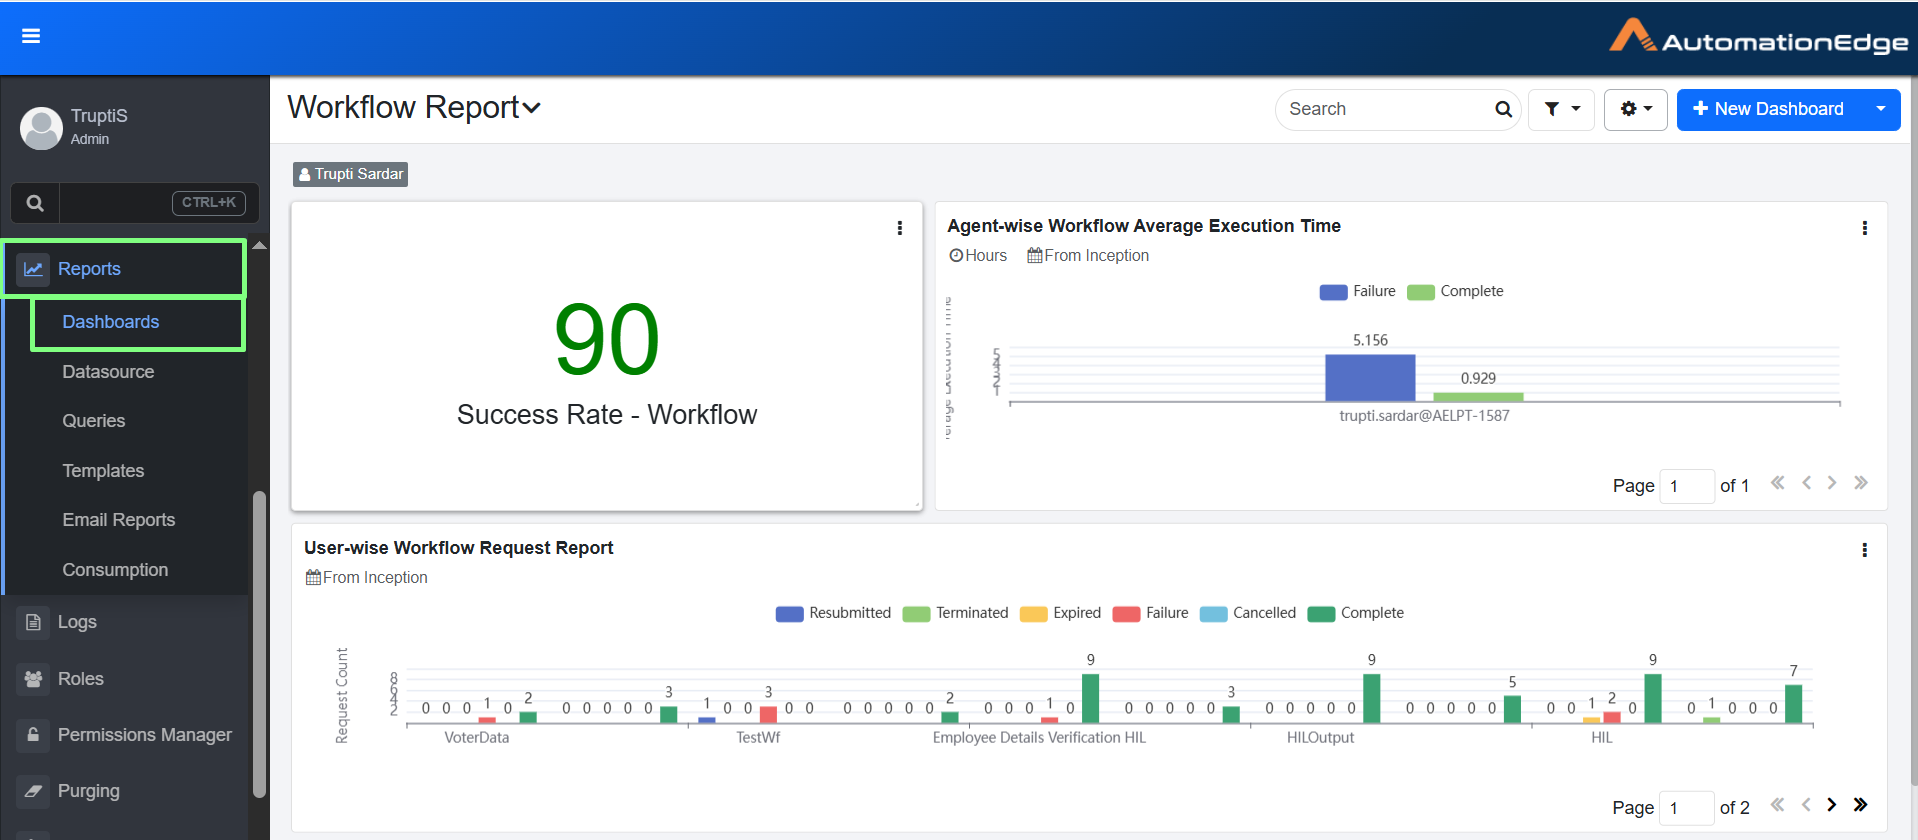
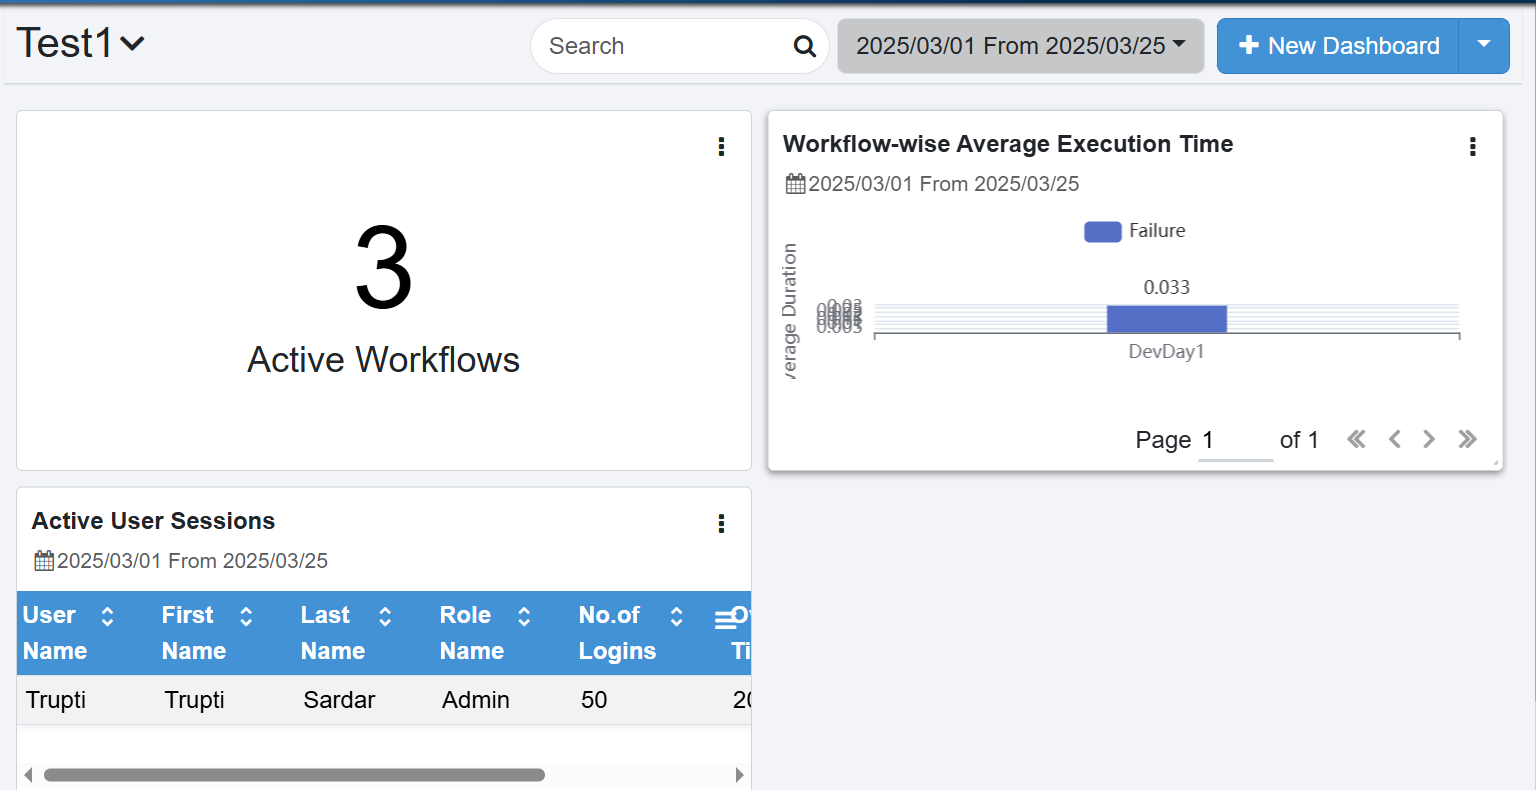
Reports Dashboards page
-
Click New Dashboard. The New Dashboard dialog appears.
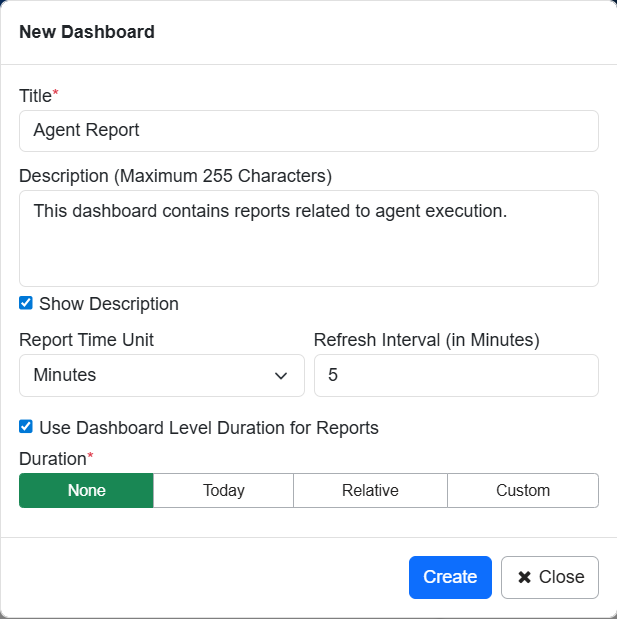
New Dashboard dialog
-
Enter the following field details:
Field name Description Title* Enter a name for the dashboard. Description (Maximum 255 Characters) Enter a description of the dashboard. Show Dashboard Select the checkbox if you want to show the description of the dashboard on the dashboard page. Report Time Unit Select the report time unit in seconds or minutes or hours. Refresh Interval (in Minutes) Enter the interval in minutes to refresh the dashboard view. You can set the refresh interval between 1-15 minutes.
Note: If you select the checkbox, then you cannot specify duration for individual reports.Duration Click any of the following tabs, as required for the dashboard:
- None: No duration details are required.
- Today: Enter the start and end hour in hours and minutes.
- Relative: Enter the duration in minutes or hours or days or months or years, either in the Last or Next tab. If you select the Last tab, then the generated report shows details of previous minutes or hours or days or months or years.
And, if you select Next then the generated report shows details of upcoming minutes or hours or days or months or years.
- Custom: Select the date range for which you want to generate the report.*Indicates mandatory field.
-
Click Create. Dashboard is created successfully.
Note-
You can select another dashboard from the list adjacent to the dashboard name.

List of created dashboards
-
You can find dashboards and reports using the search option. Enter at least two characters of the name of the dashboard or report in the search box and click
 .
.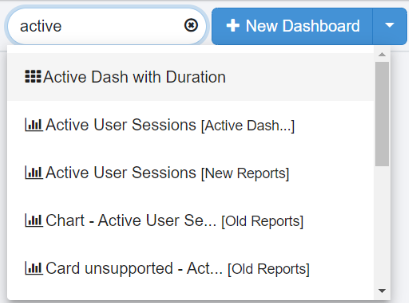
List of dashboards and reports
-
 : indicates a dashboard.
 -
 : indicates a report. In the list, the report name is followed by the name of the dashboard on which the report is available. For example, Active User Sessions [Active Dashboard].
If you search for the dashboard then the dashboard appears with the reports, and if you search for a particular report then the report appears on the dashboard and is highlighted in yellow briefly.
Dashboard report highlighted in yellow
You can search for both types of reports, that is, Out-of-the-box and Custom reports.
-
-
-
Click Submit. The report is generated.
Switch the Dashboard
To Switch the Dashboard
-
Click the arrow next to the currently displayed dashboard name. The list of dashboard appears.
-
Select the dashboard from the list. Selected dashboard appears.
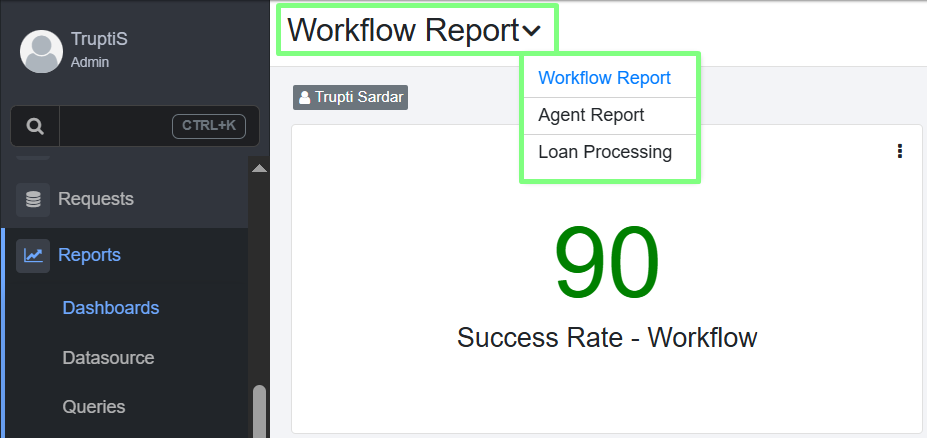
Switch Dashboard
View report options
To view report options:
Click ![]() (located in the top-right corner of the report) to perform the following actions:
(located in the top-right corner of the report) to perform the following actions:
-
Click
 to update the report with the latest data.
 -
Click
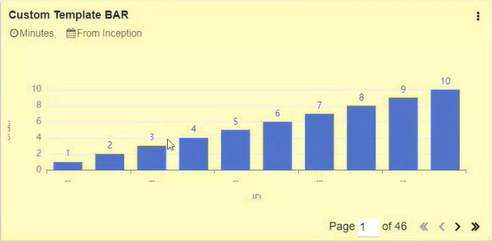
 to expand the report. The maximized view shows Report template name and the details of the report.
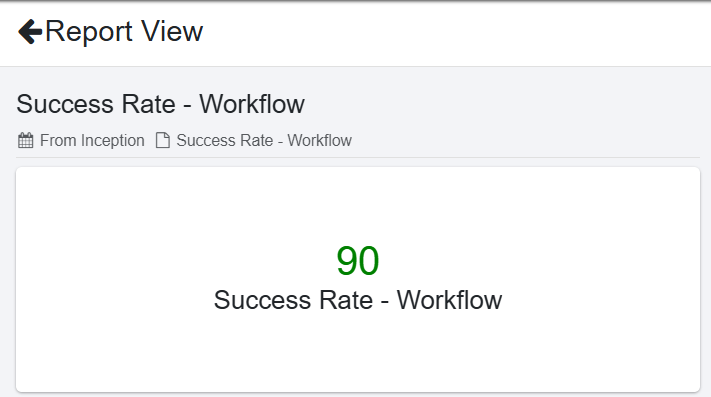
Report in maximized view
-
Click
 to save the current report in a PDF file format. The downloaded file shows Report template name and the details of the report.
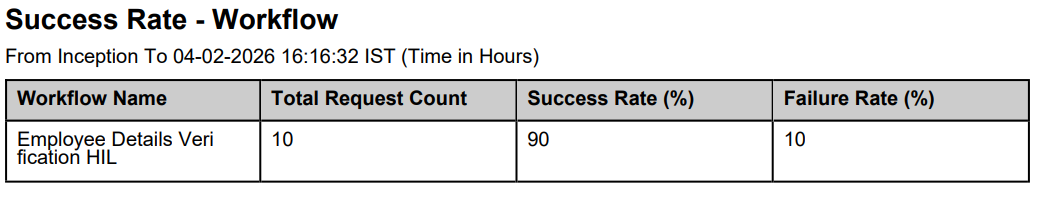
Downloaded Report in PDF format
-
Click
 to save the current report in a CSV file format. The downloaded file shows Report template name as a sheet name and the details of the report in table format.
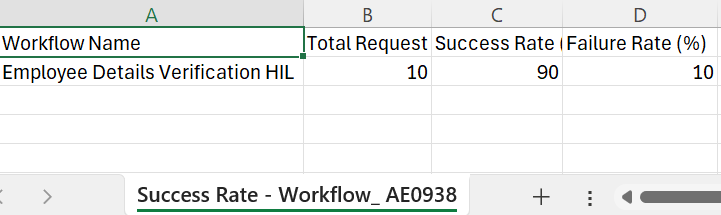
Downloaded Report in CSV format
-
Click
 to update or edit the report settings.
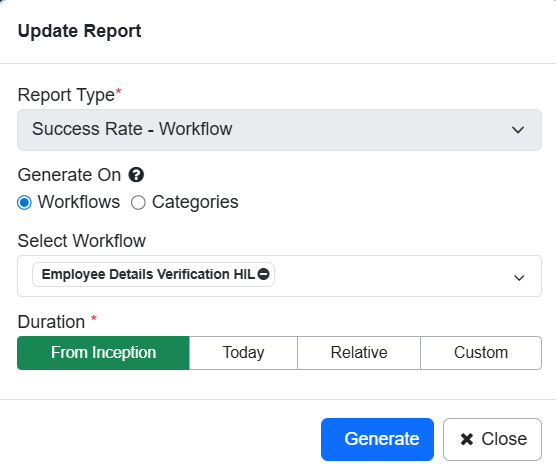
Edit Report
-
Click
 to make changes to the current report.
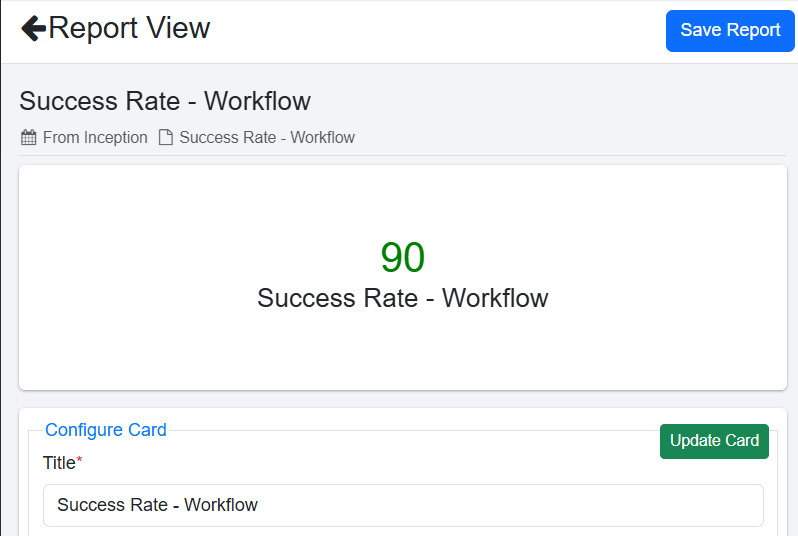
Customize report
-
Click
 to remove report from dashboard.
View dashboard settings
To view current dashboard settings:
On the Dashboard page, click ![]() . The dashboard setting is available:
. The dashboard setting is available:
-
Edit Dashboard: Click to modify the selected dashboard settings.
-
Export Dashboard: Click Export Dashboard, Confirm Password Inclusion dialog appears. Click yes if you want to export report dashboard with Password. Click Export to export the dashboard in JSON format.
-
Set As Default: Click to set the selected dashboard as the default dashboard.
NoteAfter you set the dashboard as the default dashboard, the Set As Default option is unavailable.
-
Pin to Home Page: Click to pin the dashboard to the Home page.
Note- The dashboard replaces the top four chart view on the Home page under the License Overview, Agent Threads, Assisted Agents, Step Units, and Process Studios section.
- After you pin the dashboard to the Home page, the Unpin from Home Page option is available.
-
Allow Public Access: Click to allow other tenant users of the specific tenant to view the dashboard.
NoteThe dashboard name is suffixed with the term Public in the dashboard name list.

After you make the dashboard public, the Remove Public Access option is available.
-
Toggle Fullscreen Mode: Click to view the dashboard page in full screen mode.
-
Add Report: Click to add the report on the dashboard.
-
Delete Dashboard: Click to delete the dashboard.
Apply dashboard filter
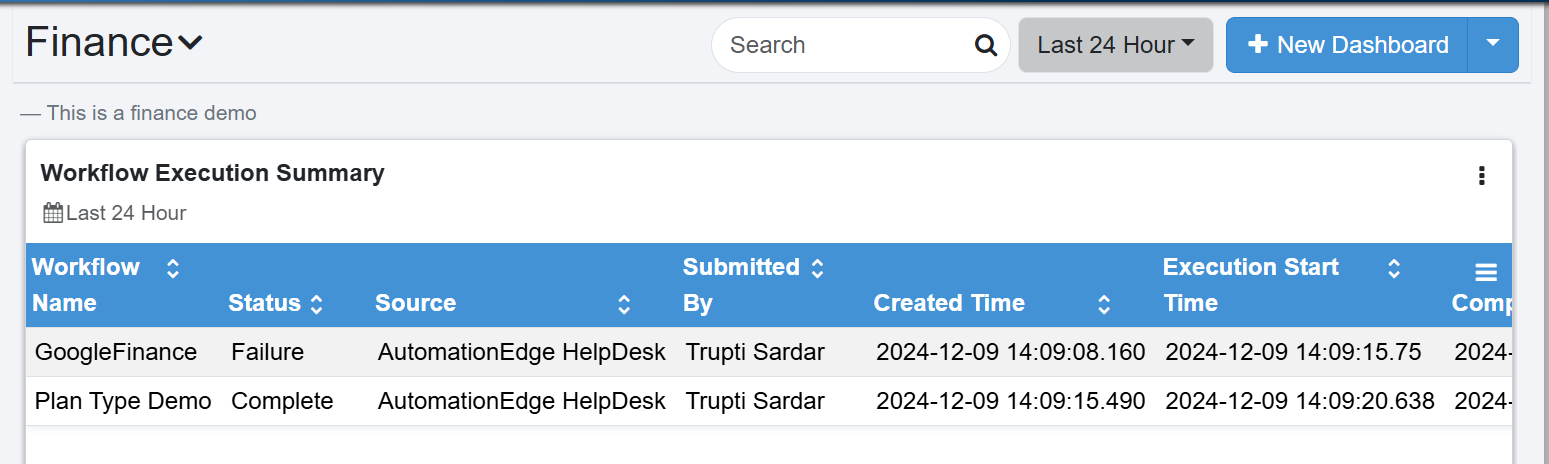
Fetch data for a specific duration on the dashboard by using the filter option. The Dashboard Filter allows users to apply live filter. The option is available only when a dashboard-level duration is selected.
Once a specific time-period is selected at the dashboard level, the filter icon becomes visible, allowing users to access and download the filtered data in PDF or CSV format.
If you apply filters on the dashboard, the filters will be applied to all reports displayed within the dashboard. Applying filters at the dashboard level ensures consistency and relevance of the data presented across all reports. This is a temporary filter, if you change the filter. You can reset the filter for the current session.
Dashboard filter
- The selected filters are temporary and cannot be saved to the dashboard.
- You can download the generated report.
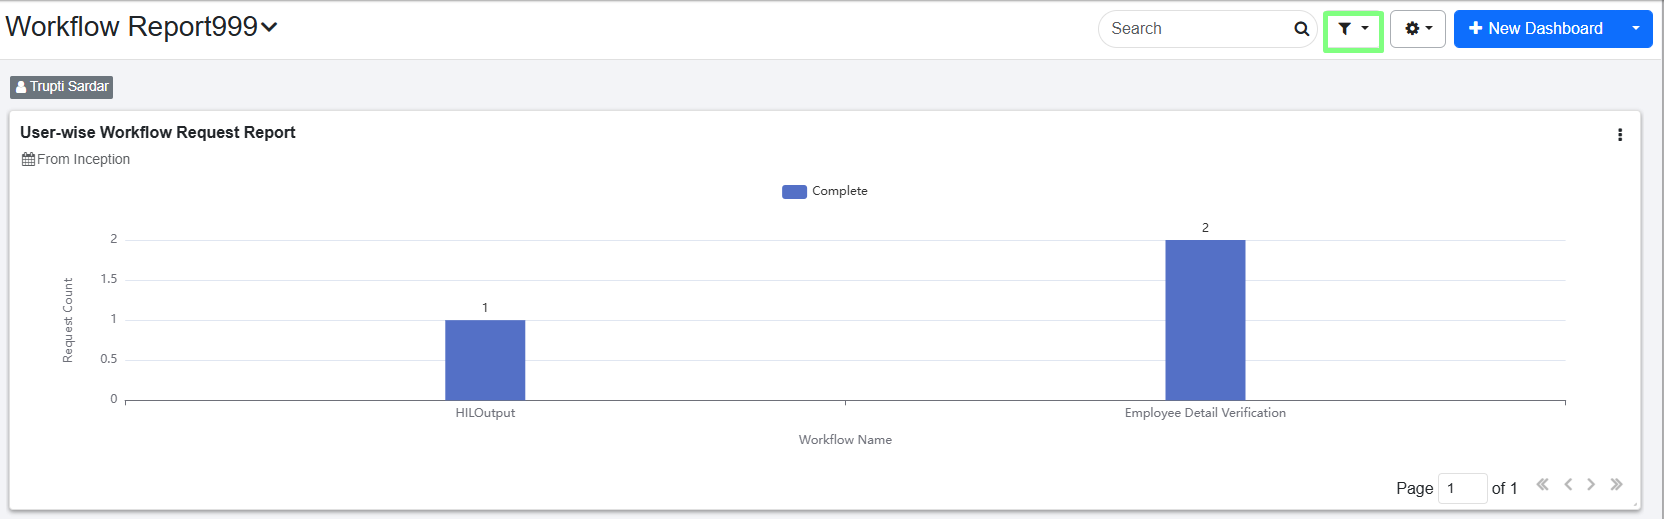
Dashboard filter
Predefined Filters
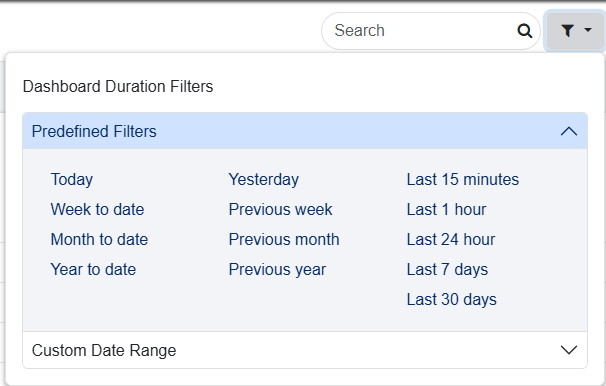
Predefined Filters
To apply a specific time frame to your dashboard, select a filter from the available options. For example:
- Today: Displays report for the current day.
- Yesterday: Displays report for the previous day.
- Last 15 Minutes: Displays report for the past 15 minutes and so on.
Predefined Filters view
Custom date range
Apply custom date range to the dashboard, as required.
To apply a custom time to your dashboard:
-
Click Custom Date Range, the date range fields appear. Select the following field details:
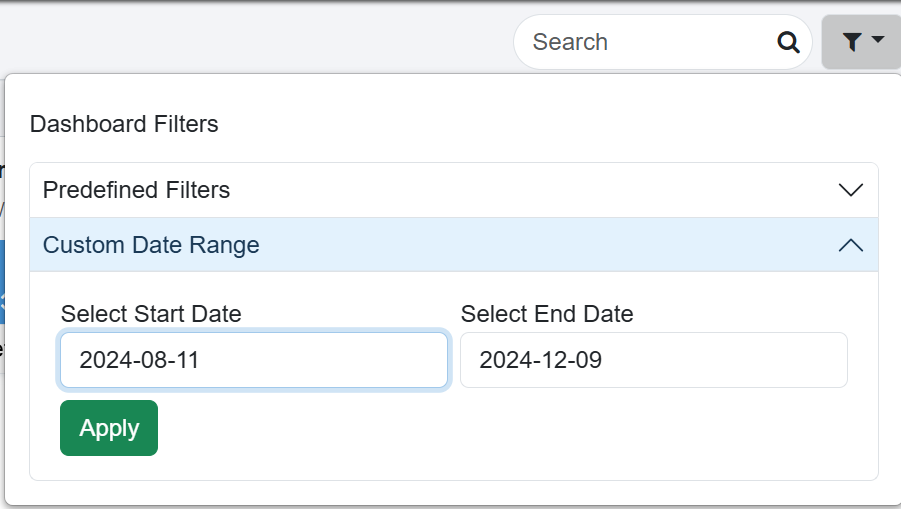
Custom Date Range dialog
- Select Start Date: Select the date from which you want to fetch the data for the report.
- Select End Date: Select the date up to which you want include the data in the report.
-
Click Apply. The report for specified date is generated.
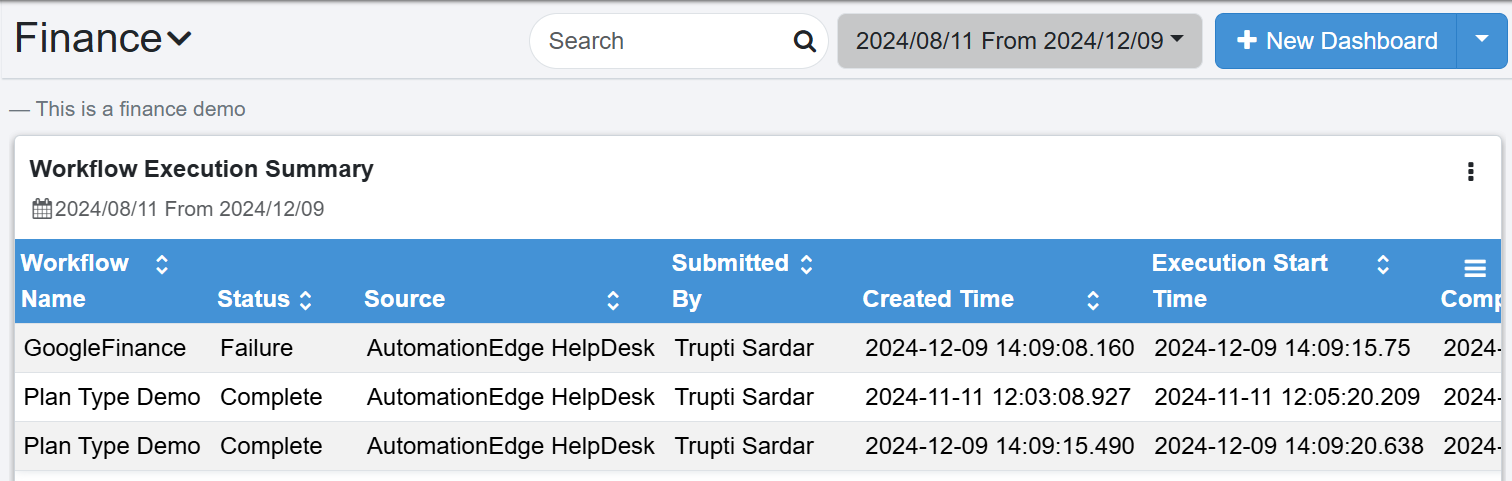
Custom Date Range view
Dashboard Options
To view options like import dashboard, manage permissions, transfer dashboard, click ![]() next to New Dashboard.
next to New Dashboard.
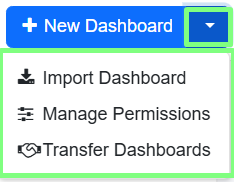
Dashboard options
Import Dashboard
Use the option to import dashboard from same or different instance.
-
Click Import Dashboard. Import Dashboard dialog appears.
-
Select Variable to edit or update the values in imported file or JSON to see the file content in JSON format.
NoteToggle the switch
 to edit the JSON code.
 -
Click Test Datasources. The datasource is validated and the option to Import is enabled.
NoteThe Dashboard name should be unique.
-
Click Import. The dashboard is imported.
Manage Permissions
Click Manage Permissions. You are redirected to Dashboard Permissions page. For details, refer Dashboard Permissions.
Transfer Dashboard
You can assign a dashboard to a specific tenant by using the Transfer Dashboard Ownership option.
To transfer dashboard ownership
-
Click Transfer Dashboards. Transfer Dashboards Ownership dialog appears.
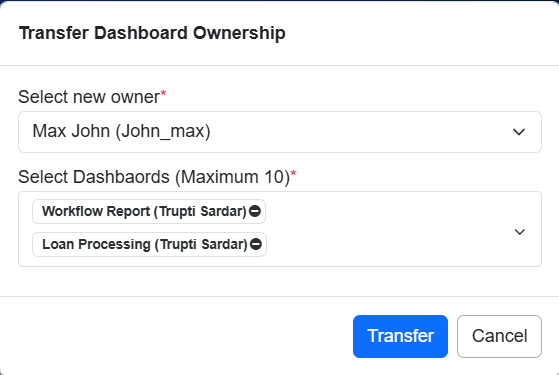
Transfer Dashboard Ownership dialog
-
Select new owner and select the dashboard from the list and click Transfer. The dashboard ownership is transferred to selected tenant.