Add reports to dashboard
Adding reports to a dashboard lets you visualize your automation data in the format that works best for you — whether that's a table, card, or chart view. Instead of switching between multiple screens, you bring the metrics you care about into a single dashboard where you can filter by dates or relative periods like hours, days, weeks, or months. Admins, Workflow Admins, Activity Monitors, and Tenant Users can add and configure reports to track execution performance, agent utilization, and workflow outcomes. You can also edit dashboards to update or reconfigure individual reports as your monitoring needs change. This gives your team a flexible, self-service way to build the views they need without relying on external tools.
Chart view is available in certain reports only. For example, Agent-wise Workflow Average Execution Time.
Add reports
In the section, you'll learn how to add reports to the dashboard. The reports can help you monitor your automation performance in several aspects.
To add a new report to dashboard:
-
In the menu, click Reports → Dashboards. The Dashboards page appears.
-
Select a dashboard from the dashboard list. For example, Productivity.
-
Click
 and then select Add Report. The New Report dialog appears.
New Report dialog
NoteThe Duration field is available only if the Use Dashboard Level Duration for Reports checkbox in the New Dashboard dialog is clear.
-
Enter the following field details:
Field name Description Report Type * Select the type of report you want to generate. For more details about the reports, see Out-of-the-box reports section. Generate On * Select the radio button next to Workflow or Categories. The field is available depending on the type of report selected. Select Workflows
or
Select CategoriesSelect the workflows or categories for which you want to generate the report.
Note: The field is available depending on the type of report selected and the option selected in Generate On.Page Size * Click the page size tab, as required. Duration * Click any of the following tabs to specify the duration: None or Today or Relative or Custom.
Note:
- If you selected the Use Dashboard Level Duration for Reports checkbox when creating the dashboard, then the report inherits the same duration details.
- Duration type description is same as provided in the Create a new dashboard section.*Indicates mandatory field.
-
Click Generate. The Report View page appears.
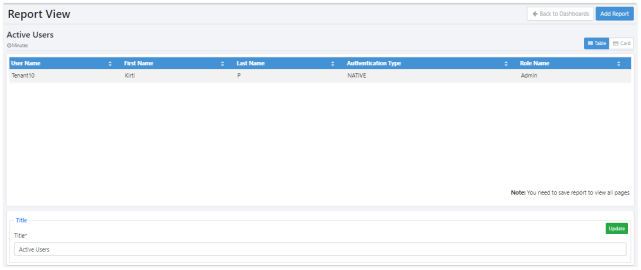
Report View page
The following tabs are available in the Reports View:
- Table: Tabular format is the default view. You can sort the report in an ascending or descending order. In the Title field, modify the report name, and then click Update.
- Card: The report appears as a card displaying details of the first record.
- Chart: The report appears as chart, such as Bar chart, Pie chart, and so on.
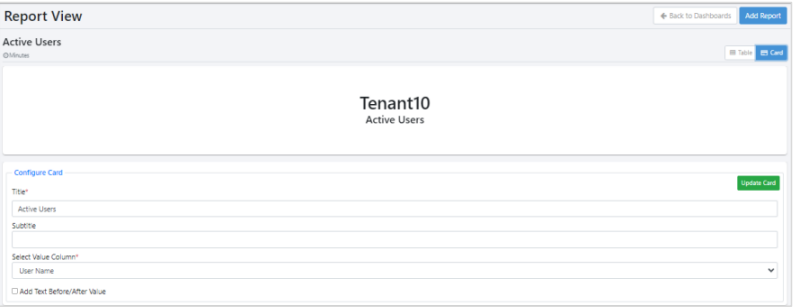
Report card view
In the Configure Card section, modify the following field details, and then click Update Card:
- Title: Modify the name of the report.
- Subtitle: Enter a subtitle for the report, if required.
- Select Value Column: Select the column whose value you want to show in the card.
- Add Text Before/After Value: Select the checkbox to add text before or after the displayed value.
-
Click Add Report. The report is added to the dashboard. OR Click Back to Dashboard to discard the report.
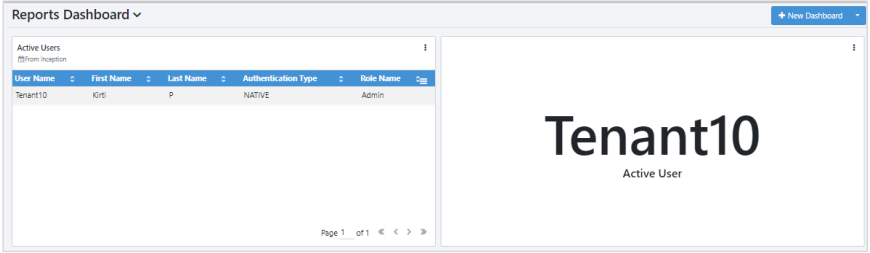
Report added to dashboard
-
Click Save Layout. The look and feel of the dashboard are saved.
NoteYou can save the layout each time you resize or reposition the reports on the dashboard.
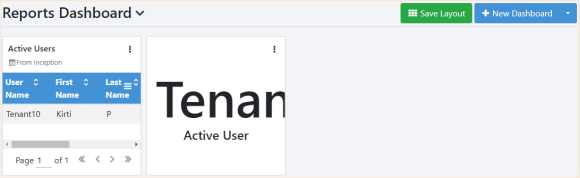
Report options
There is a set of report options that you can access in the report. Click the vertical ellipse available in the top-right corner of the report page. The report options appear.
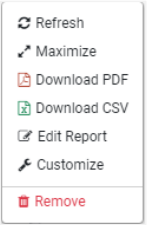
Report options menu
Following are the report options:
- Refresh: Click to refresh the report view.
- Maximize: Click to maximize the selected report view and scroll through the pagination option, if available.
- Download PDF: Click to download the report as a PDF.
- Download CSV: Click to download the report in CSV format.
- Edit Report: Click to update the selected report details, such as duration, page size, and so on, and then generate the report again.
- Customize: Click to customize the selected report in a maximized view, as required. You can change the view type, Table, Chart, or Card, as supported by the template.
- Remove: Click to delete the report from the dashboard.
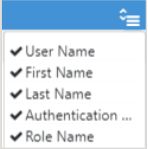
In the tabular format of the report, use the toggle to add or remove columns from the selected report view.
Generate report Chart View
You can generate chart view of the report.
To generate report with Chart view:
-
In the Add Report dialog, select the report that has the Chart view option. For example, Agent-wise Workflow Average Execution Time.
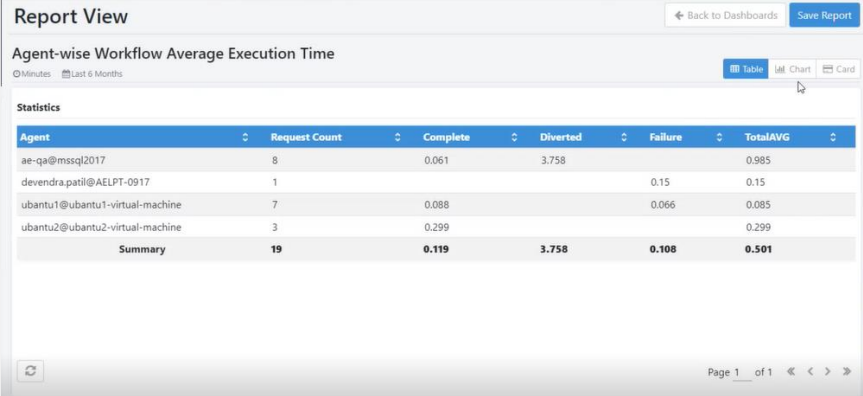
Add Report dialog with Chart view option
-
Click Chart tab. The chart view appears.
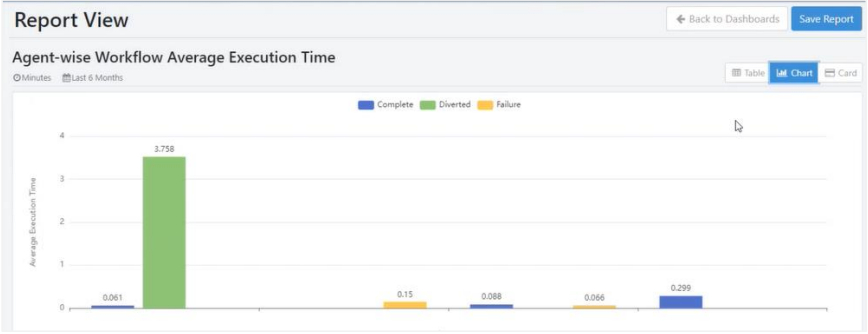
Chart view of the report
-
In the Configure Chart Options section, set the following:
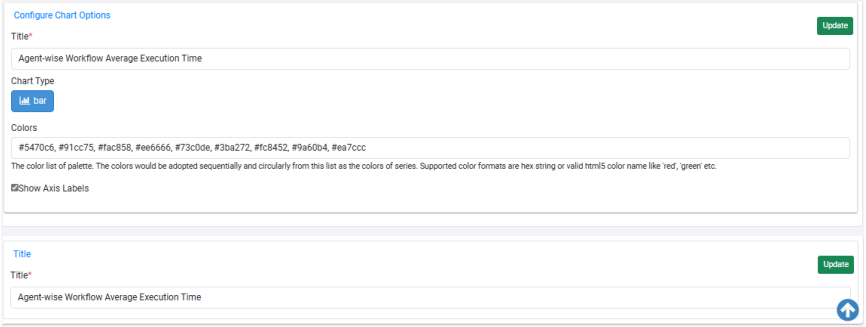
Configure Chart Options section
Field name Description Title * Enter the title of the report. Chart Type Click respective tab to generate the report view:
- Bar: Data is represented with bars.
- Doughnut: Data is represented in a circular format with different colors.
- Gauge: Displays the partial progress towards a specific value. The value is derived from the first-row result of the report query.
- Line: Graph uses lines to connect individual data points.
- Pie: Data is represented in a pie format with different colors.
- Polar: The following image represents the polar view.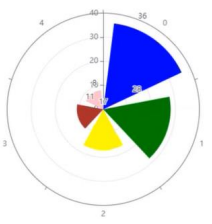
- Step line: Data is represented in step line chart format.
Note: The report view is applicable for Agent Utilization Report.Colors Enter the color codes with which you want to represent the data in the chart view.
Note: You can enter multiple color codes in the hex string or valid html5 color names.Show Axis Labels Select the checkbox if you want labels to appear on the X-axis. The following fields are available only if you select Gauge chart type: Minimum Value Enter the minimum value from which the calibration will start. For example, 0. Maximum Value Enter the maximum value where the calibration will end. For example, 40. Start Angle Enter the angle at which the minimum value will be viewed. End Angle Enter the angle at which the maximum value will be viewed. Use Color Codes Select the checkbox to use the predefined color codes from the custom report template.
Note: Configure the color codes as type String in the Report column of the custom report template. The color codes must be entered in decimal format in the range 0 to 1.0. -
Click Update. The settings are applied to the view.
-
Click Save Report. The report appears on the dashboard.