Workflow Monitoring
You can monitor the progress of workflow executions through the Workflow Monitoring feature. The feature allows you to track completed, ongoing, and pending jobs.
In addition, you can also view a process and its child workflow or process through the Graph tab available on the Workflow Execution Metrics page.
To use the feature, ensure the following:
- In the ae.properties file, configure ae.workflow.monitoring.enabled = true. For more information, see AutomationEdge Installation Guide.
- Setup the workflow monitoring microservice. For details, see the Workflow Monitoring Deployment Guide.
View workflow monitoring metrics
You can view the workflow monitoring metrics.
To view workflow execution metrics:
-
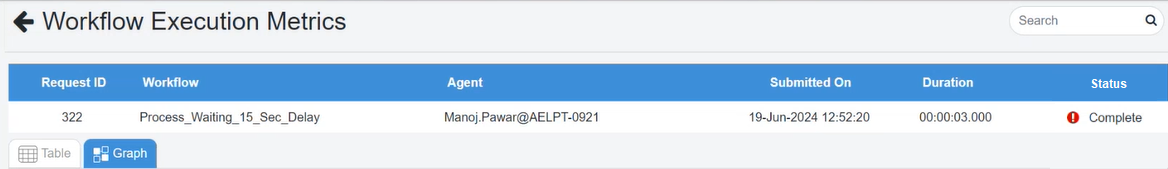
In the menu, click Requests → Workflow Monitoring. The Workflow Execution Metrics page appears.
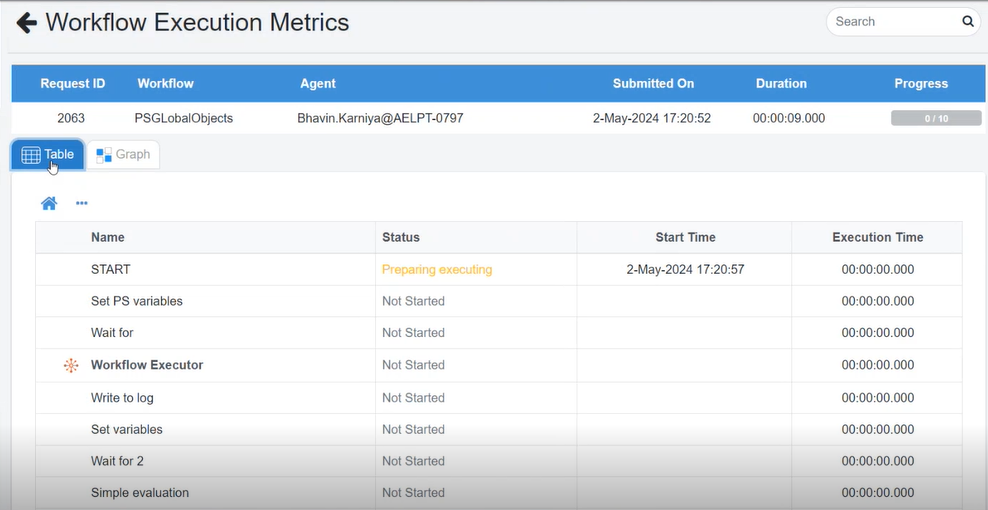
Workflow Execution Metrics
NoteIn the Sort By list, select the option by which you want to sort the workflows. The available options are:
-
Failure - selected by default. Prioritizes workflows with failures or errors at the top of the list. You can quickly identify and address any issues that require attention and resubmit the request.
-
Ascending
-
Descending
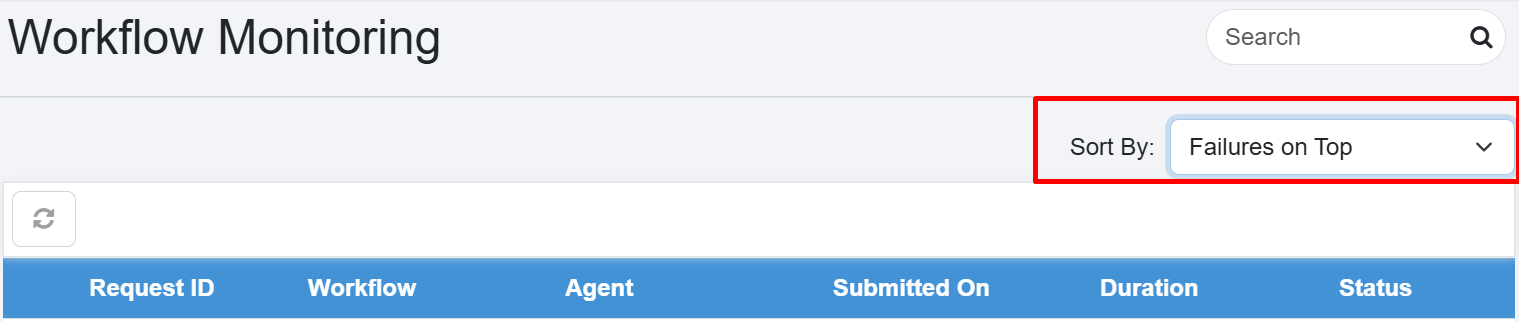
Sort options for workflow monitoring
-
-
View the following field details:
Field Name Description Request Id Displays the selected request ID. Workflow Displays the workflow name. Agent Displays the name of the agent. Submitted On Displays the date of request submission. Duration Displays the duration of workflow execution. Progress Displays the progress of child workflows or processes. Child workflow or process fields Note: If the main file of your workflow is .psw, then you can see the child workflow or process details in the Table view only. You cannot see the details in the Graph view. Name Displays the name of step or entry or childworkflow or process. Status Displays the execution status of the step or entry or child workflow or process. Rows Displays the read, write, or failed step or entry or child workflow or process. Start Time Displays the execution start time of the step or entry or child workflow or process. Execution Time Displays the total execution time of the step or entry or child workflow or process.
Sample Child workflow or process monitoring
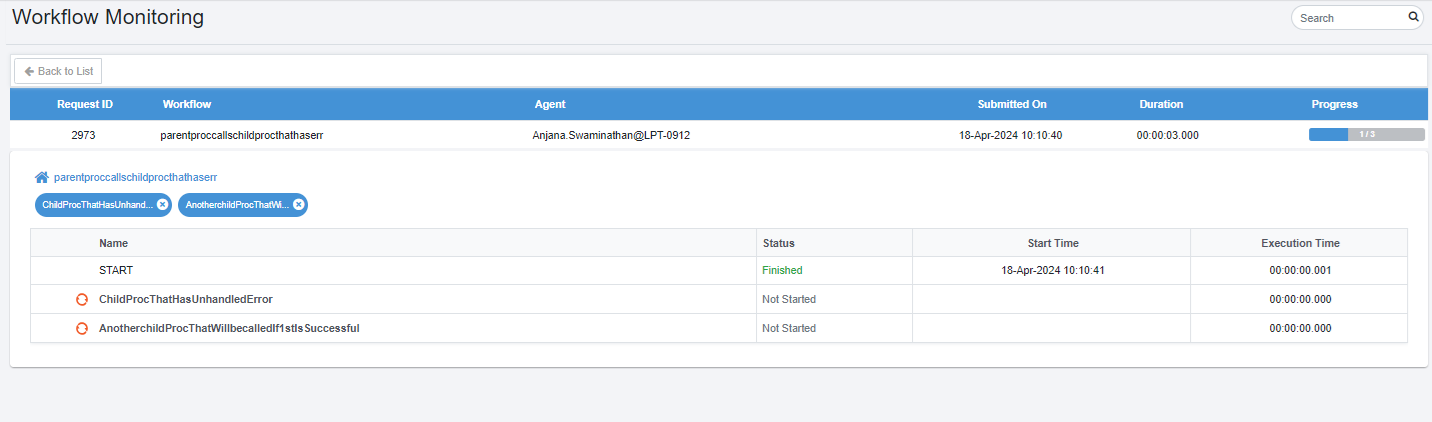
Child workflow monitoring - overview
Child workflow monitoring - details
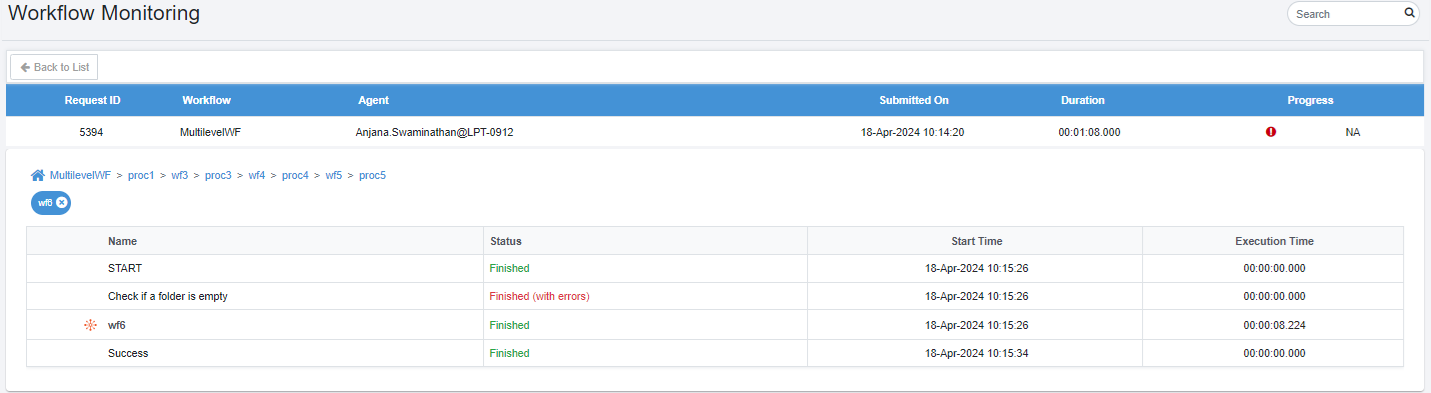
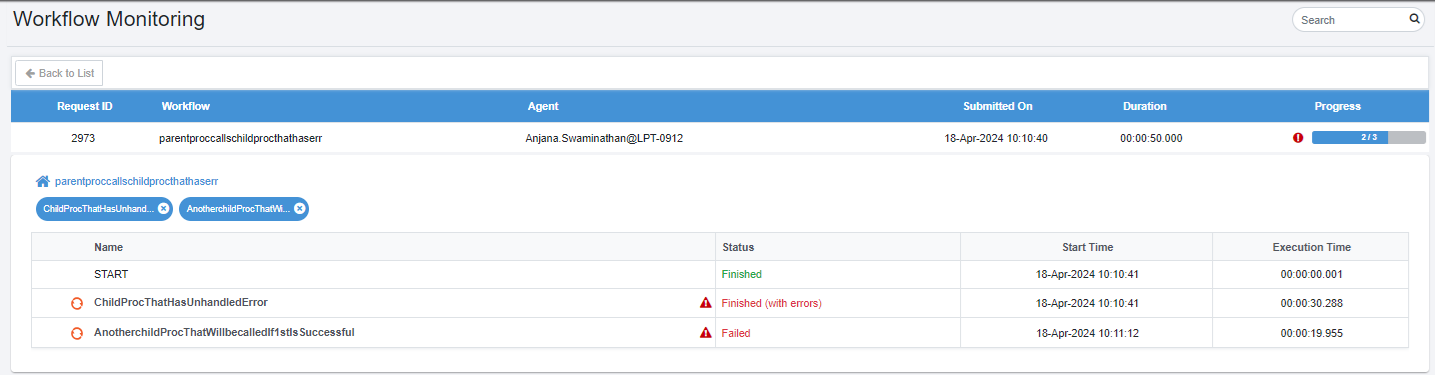
Child workflow monitoring - expanded view
To work with graph view:
You can view the details of a child process or workflow in the graph view.
-
In the Workflow Execution Metrics page, click the Graph tab. The Graph View appears.
Workflow Execution Metrics
-
In the Graph view see the following:
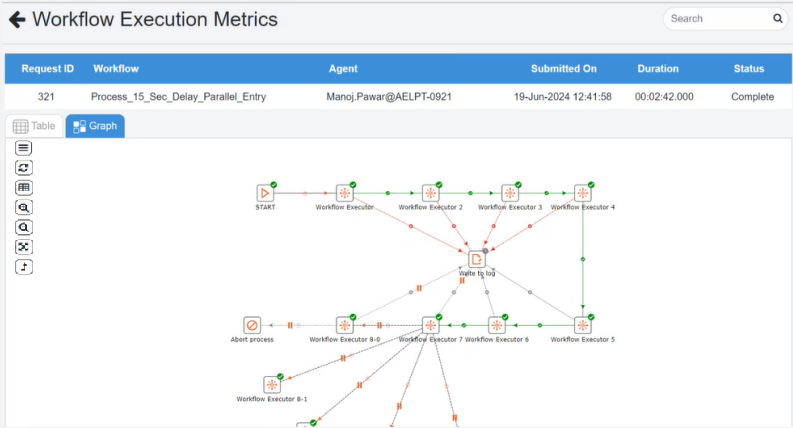
Graph view
NoteFor live monitoring, if the main file of the workflow is a process file, then you can choose to see the progress in the form of table or graph.
-
To view the live monitoring of the workflow, click the Graph tab. You will see the progress as follows:
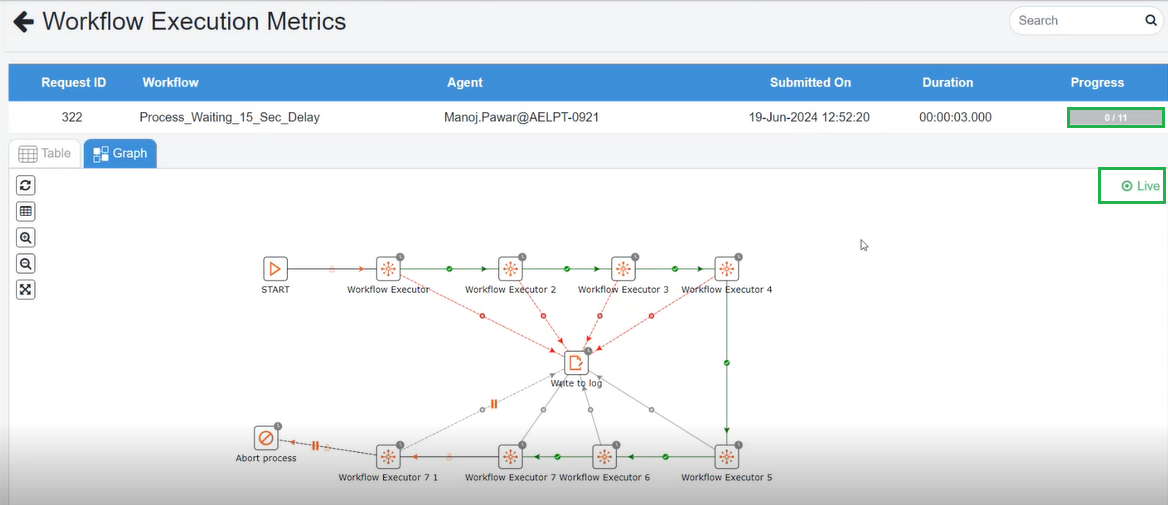
Graph view – Live Monitoring
-
The Progress column displays the number of steps that are completed in the workflow execution. The following icons indicate various stages of the steps:
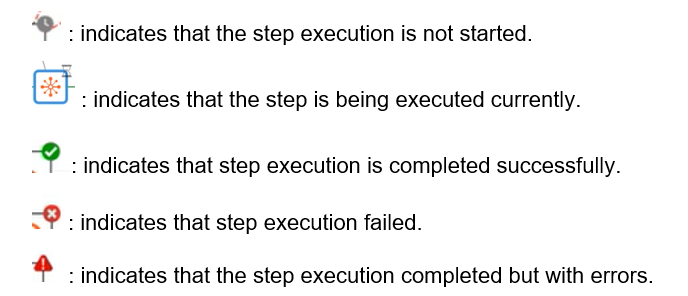
Workflow execution progress icons
After the workflow execution is completed Status column is displayed instead of the Progress column.
Graph view – Live Monitoring
Additional information:
-
You can use the following tools to:
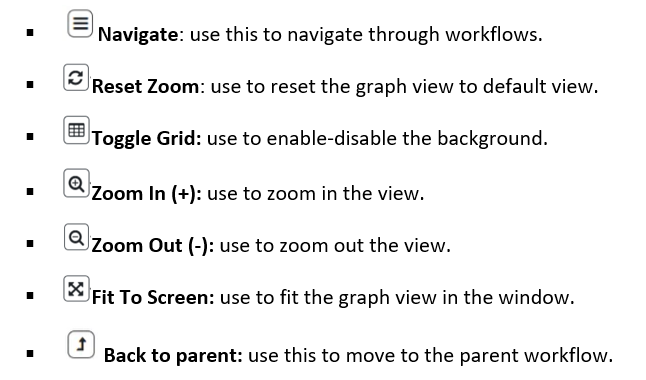
Navigation tools for graph view
-
Hover the mouse over an entry to view the following details:
-
Status: If the step execution is started, completed, failed, and skipped. The Skipped status will be visible only if you select specific point from which to restart the execution.
-
Start Time: Displays the time when the step execution started.
-
End Time: Displays the time when the step execution completed.
-
Execution Time: Displays the time taken to complete the step execution.