Work with debugging and search
In the chapter, you will learn about how to search for metadata in workspace, project, or open workflow or process. You will also learn about debugging workflows.
The chapter consists of the following topics:
Add a breakpoint
A breakpoint is a signal that tells the debugger to temporarily suspend the execution of the workflow at a particular step in the workflow. Use of breakpoints is helpful when debugging a workflow.
All input steps cannot have breakpoints. For example, Excel Input and Generate Rows.
The topic includes the following sections:
Add a breakpoint
The section explains how to add a breakpoint to a workflow.
To add a breakpoint:
-
Open a workflow and select a step.
-
Right-click on the selected step and in the contextual menu, select Breakpoint Actions. The sub-contextual menu appears.
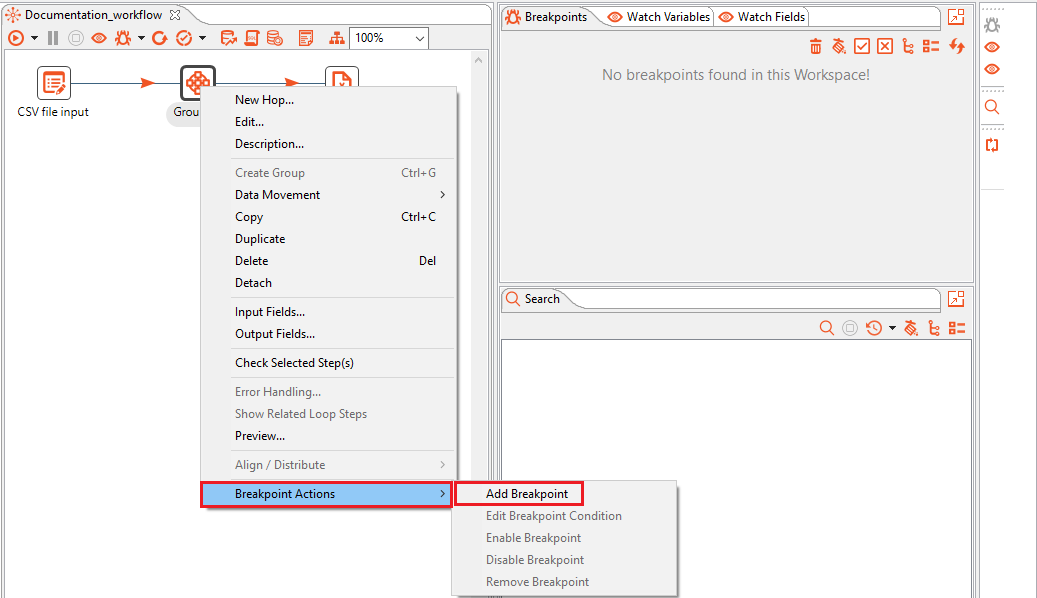
-
In the sub-contextual menu, select Add Breakpoint. The Add Breakpoint dialog appears.

-
In the dialog enter the condition for the breakpoint on the selected step. Click OK to save the details.
note- To reset the breakpoint condition, click Clear Condition.
- A breakpoint on a step without any condition pauses at each row in that step.
- A breakpoint added with a condition pauses at the row only if the condition is true.
-
Run the workflow in debug mode. The details appear in the Breakpoints, Watch Variables, and Watch Fields tabs, and the row data and variables appear in the Debug tab of Execution Results.
Part 1: Breakpoints, Watch Variables, and Watch Fields tabs
i. Breakpoints tab:
-
To enable all breakpoints, click

-
To disable all breakpoints, click

-
To remove selected breakpoints, click

-
To remove all breakpoints, click

-
To expand all projects, click

-
To refresh the breakpoint view, click

ii. Watch Variables tab:
View and monitor all the user selected variables and their values in the workflow in the Watch Variables tab. You can add or update one or more variables and click Update Variables to save the entries.
 note
noteIn addition to all environment variables, such as Workflow.Entry.Current.Directory. You can also add more variables.
iii. Watch Fields tab:
View and monitor all the user selected fields and their values in the workflow in the Watch Fields tab. You can add or update one or more variables, and click Update Fields to save the entries.
 note
noteIn addition to all environment variables, such as Workflow.Entry.Current.Directory. You can also add more variables.
Part 2: Execution Results: Debugging a workflow
In Execution Results section, Logging, Step Metrics, Metrics, Preview data, and Debug tabs are available.
noteIf you run a process, only the Logging and Process metrics tabs are available.
i. Logging tab:
In the Logging tab, view information about a process or workflow, such as the number of records inserted and the total elapsed time spent in a workflow. In addition, you can view detailed information, such as exceptions, errors, and debugging details.
ii. Step Metrics tab:
In the Step Metrics tab, view detailed information of each step in the workflow.
iii. Metrics tab:
In the Metrics tab, view the Gantt chart after the workflow execution is complete. It displays information about time spent on each step.
iv. Preview data:
In the Preview tab, view the data passing through each step. Select the step to view its data value.
v. Debug tab:
-
To resume execution from the current breakpoint to the next breakpoint, click

-
To go to the next step in a workflow, click

-
To resume execution of all paused rows, click

-
Additional breakpoint actions
The section explains how to use additional breakpoint actions.
To use additional breakpoint actions:
-
Select the step for which you have added the breakpoint, and right-click on it. The contextual menu appears.
-
Select Breakpoint Actions, and then use the following actions, as required:
-
Edit Breakpoint Condition: Modify the breakpoint details.
-
Enable Breakpoint: Turn on the disabled breakpoint.
noteThe action is unavailable if the breakpoint is active.
-
Disable Breakpoint: Turn off the active breakpoint.
noteThe option is available only if the breakpoint is active.
-
Remove Breakpoint: Delete the existing breakpoint.
-
Best practices
-
You will get an error message, if you try to debug multiple workflows. Therefore, avoid debugging multiple workflows simultaneously.
-
You will get an error message, if you try to close parent and / or child workflow before the execution of the parent workflow is completed or terminated.
-
You must not change the order of the steps on the canvas while debugging a child workflow, as this may cause breakpoint highlight and step mismatch.
noteYou cannot preview row data on a breakpoint step in Debug View after the workflow proceeds to the next step. However, if the breakpoint has Null or Not Null condition, you can view the previous row data.
Search metadata
Search the metadata available in the workspace, project, or open workflow or process.
To search a metadata:
-
Click Edit, and select Search Meta data... or CTRL + F. The Search dialog appears.
 note
noteYou can also search for metadata using the Search tab. Click
 to open the Search dialog.
-
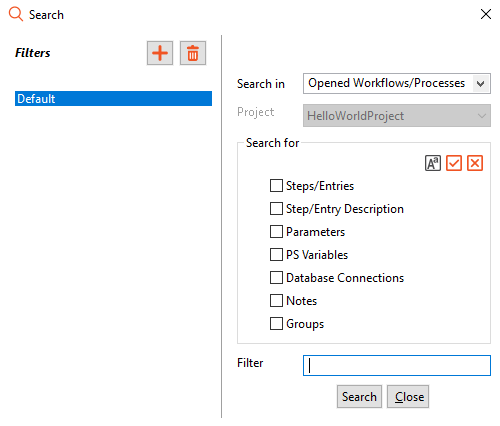
In the Search dialog, enter or select details as required.
Field name Description Filters Displays the filters defined for search. The default filter is Default.
- To add a new filter, click
- To delete a filter, click
- If you delete the Default filter an error message appears.
- If you add or select existing filters, then the field Filter Name appears in the dialog box.Search in Select the scope of search. Available search scope options are:
- Workspace
- Projects
- Opened Workflows/ProcessesProject Select the project in which you want to search the metadata. The field is available only if you select Project in Search in. Search for Select the checkbox against metadata you want to search for in the workspace, project, or open workflow or process.
- To make the search case sensitive, select . If the search is case sensitive, then the icon appears as
- To search all metadata, select
- To clear the selected metadata, select
- You must select at least one metadata for search.Filter Enter the filter criteria.
The field is optional and valid values are a simple string or regular expression. For example, name. -
Click Save, and then click Search. The results of search appear in the Search tab.
-
In the Search tab, use available tools as follows:
-
 : Click to stop the search.
 -
 : Click to view the recent search history with the latest search at the top. Click Clear History to clear the search history.

-
: Click to clear any search results in the search pane.
-
: Click to expand all projects.
-
 : Click to collapse all projects.
-